



Hyperliquid’s native token HYPE price is attempting to recover after several weeks of corrective price action, with bulls eyeing a breakout above the $64 resistance zone. The token has been trading within a falling wedge, a pattern often associated with bullish reversals as buyers gradually regain control following the recent pullback.
Beyond the chart, Hyperliquid presents a mixed picture. While Open Interest has climbed to a record $5.7 billion, indicating growing derivatives participation, weekly active users have declined since June, suggesting network activity has cooled. Whether these conflicting signals translate into a sustained breakout or another rejection remains the key question for traders.
HYPE Price Approaches a Breakpoint
After rallying to nearly $72, HYPE entered a corrective phase, carving out a falling wedge characterized by lower highs and lower lows. Unlike a strong bearish trend, the decline has gradually lost momentum, with buyers consistently defending the $56–57 support zone.
Price is currently trading around $60.40, just below both the wedge’s upper trendline and the $64 horizontal resistance. This area has repeatedly rejected buyers over the past month, making it the most important level to reclaim before bulls can target higher prices.


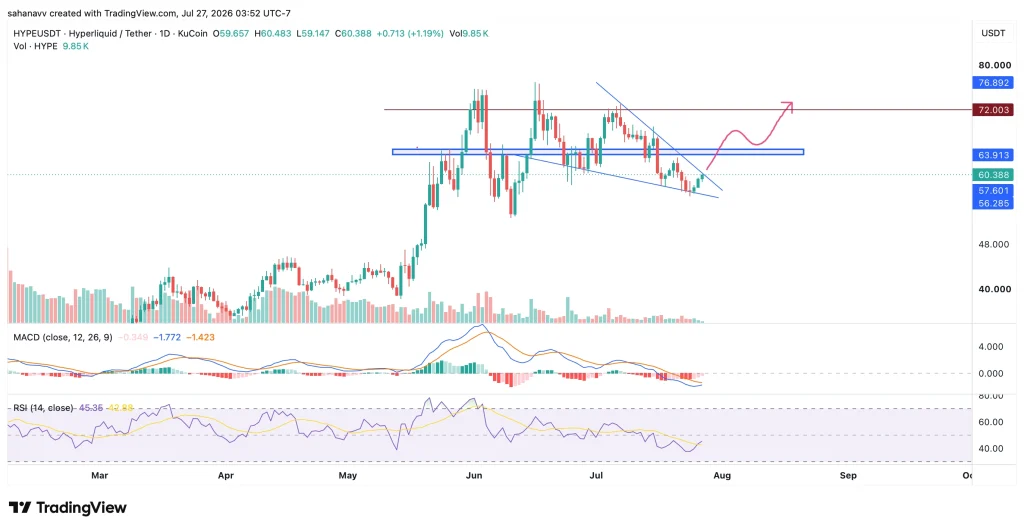
Momentum indicators also suggest selling pressure is easing. The RSI has recovered to around 45 after approaching oversold territory, while the MACD histogram continues to shrink, indicating bearish momentum is fading even though a bullish crossover has yet to materialize. Overall, the technical structure is improving, but confirmation will only come once HYPE closes decisively above $64.
Derivatives Are Bullish While On-Chain Activity Cools
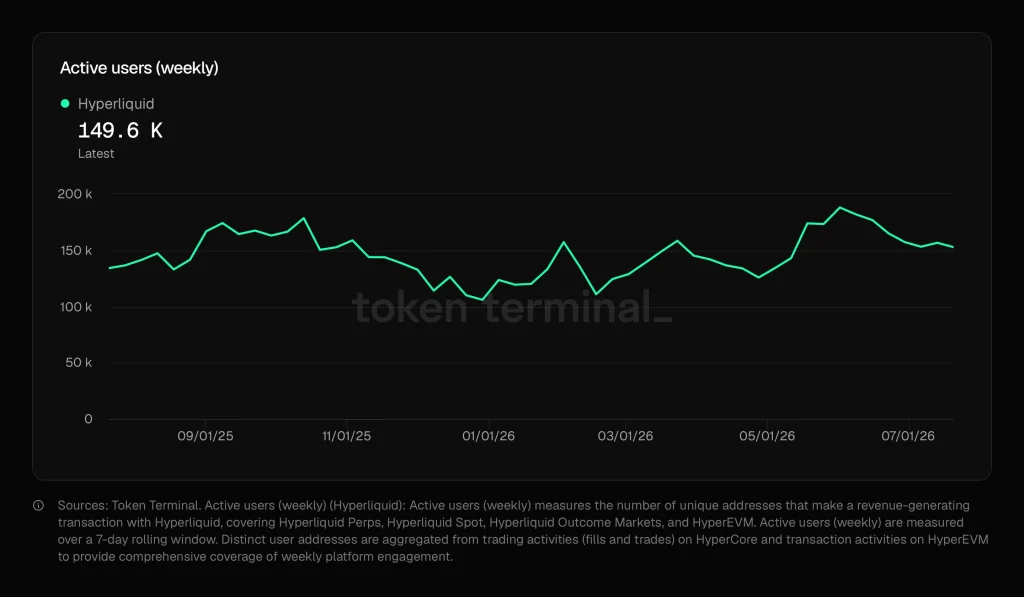
One of Hyperliquid’s biggest strengths remains its underlying network activity, which has cooled while the derivatives display a divergence. Weekly active users have fallen from nearly 190,000 in early June to around 149,600, indicating that network activity has cooled over the past several weeks. The decline suggests retail participation has moderated following the platform’s earlier surge in activity.
On the other hand, derivatives activity continues to strengthen. Open Interest has climbed to a record $5.7 billion, indicating that traders are committing more capital to perpetual futures despite softer on-chain participation.
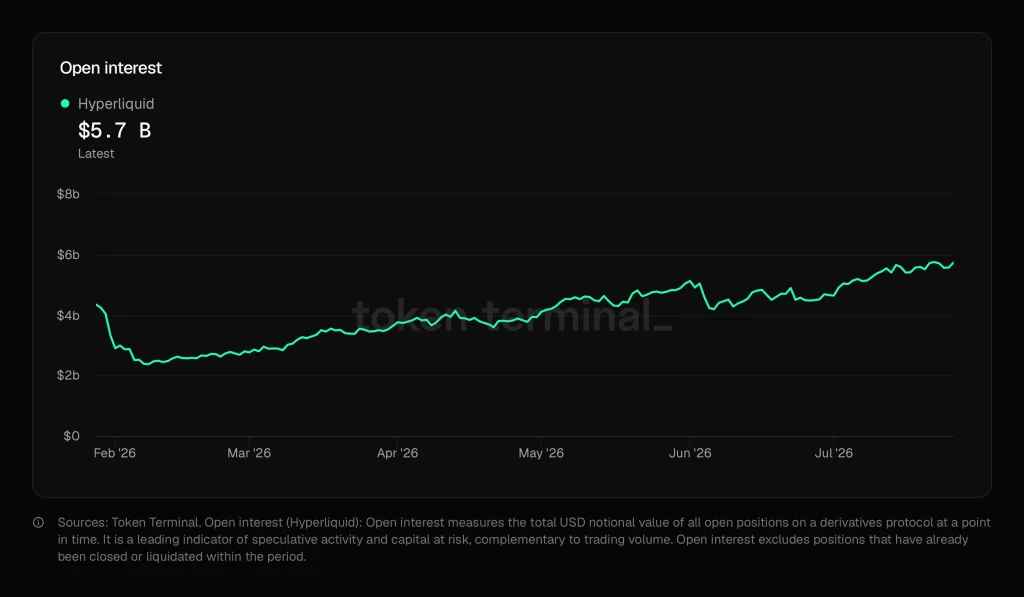
This divergence deserves attention. Rising Open Interest typically reflects growing speculative conviction, while declining active users point to slowing organic network growth. Ideally, a sustainable rally is supported by both expanding user activity and increasing market participation. If leverage continues building while on-chain engagement weakens, HYPE could become more vulnerable to sharp volatility around major resistance levels.
Bullish & Bearish Scenario
A daily close above $64, supported by rising volume, would confirm the falling wedge breakout and shift momentum back in favor of buyers. If bulls successfully reclaim this level, the next major upside target sits near $72, where HYPE previously faced strong selling pressure.
Bearish Scenario
Failure to break above $64 could extend the current consolidation within the wedge. A decisive break below the $56–57 support zone would invalidate the bullish pattern and increase the probability of a deeper correction before buyers attempt another recovery.
Can Hyperliquid (HYPE) Price Reach $70?
Hyperliquid (HYPE) price is approaching a decisive technical turning point. The chart is gradually turning constructive, with buyers defending higher lows and price pressing against a key breakout zone. At the same time, record Open Interest reflects growing trader confidence, but the steady decline in weekly active users suggests that speculative positioning is currently outpacing network growth.
The next move is likely to be determined by $64. A convincing breakout above this resistance would strengthen the case for a retest of $72, while another rejection could keep HYPE trapped in consolidation. Until either scenario unfolds, traders should watch whether improving price action is eventually matched by a recovery in on-chain activity.
Was this writing helpful?
Story Ends Here
Trust with CoinPedia:
CoinPedia has been delivering accurate and timely cryptocurrency and blockchain updates since 2017. All content is created by our expert panel of analysts and journalists, following strict Editorial Guidelines based on E-E-A-T (Experience, Expertise, Authoritativeness, Trustworthiness). Every article is fact-checked against reputable sources to ensure accuracy, transparency, and reliability. Our review policy guarantees unbiased evaluations when recommending exchanges, platforms, or tools. We strive to provide timely updates about everything crypto & blockchain, right from startups to industry majors.
Investment Disclaimer:
All opinions and insights shared represent the author’s own views on current market conditions. Please do your own research before making investment decisions. Neither the writer nor the publication assumes responsibility for your financial choices.
Sponsored and Advertisements:
Sponsored content and affiliate links may appear on our site. Advertisements are marked clearly, and our editorial content remains entirely independent from our ad partners.
Read the Next News





Be the first to comment