


What to know:
- QNT breaks below a long-term ascending trendline, signaling a potential shift from bullish structure to sustained bearish momentum.
- Price declines to around $65.47 amid strong selling pressure, with key moving averages (20, 50, 100, 200 EMAs) all broken.
- Technical indicators weaken significantly, as RSI drops near oversold territory, confirming intense downward momentum.

QNT has broken below its long-term trendline, shifting momentum to bearish as sellers take control. The QNT price has fallen below key averages with weakening indicators and strong downside pressure. Any relief bounce may face resistance, while declining leverage suggests cautious sentiment and risk of further downside.
At the time of writing, QNT is trading at $65.47 with a 24-hour trading volume of $20.72 million and a market capitalization of $790.42 million. Despite the loss of 7.74% over the last 24 hours, the question is whether the QNT price could reclaim its key support to keep the bullish trend intact.


Source: CoinMarketCap

Quant Price Weakens After Key Trendline Breakdown
Furthermore, the crypto analyst Alpha Crypto Signal highlighted that the QNT price has broken below a long-standing ascending trendline that previously defined its bullish structure through a sequence of higher lows.
The breakdown occurred near a key support zone, weakening momentum and signaling a potential shift in market structure as sellers gained control and buyers failed to defend the trend continuation.


Source: Alpha Crypto Signal’s X Post
The QNT price may now attempt a relief bounce back toward the broken trendline, which could act as resistance. If rejection occurs there, downside continuation becomes more likely, with further support levels coming into focus.
As long as the QNT price remains below the reclaimed structure, the broader bias stays tilted toward continued weakness and bearish pressure.
Also read: QNT Price Breakout Targets $360 Rally After Reclaiming Key Moving Averages
QNT Price Faces Pressure Below Key Moving Averages
According to TradingView, the QNT price showed a sharp decline following many weeks of consolidation. Not being able to hold onto the important support level of $84.00, the QNT price tumbled sharply to reach $65.56, marking an almost 6% plunge.
The big red candlestick pierced all the EMAs, 20, 50, 100, and 200, in one go, reversing all previous gains made during spring.
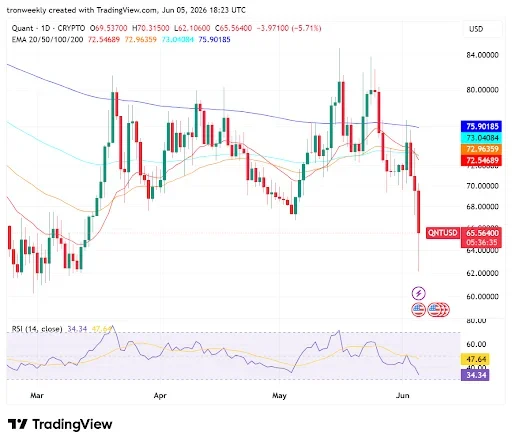

Source: TradingView
Technical indicators show massive selling power. The EMAs have been falling sharply downwards, suggesting a potential bearish crossover in the near future.
Meanwhile, the RSI has fallen sharply to 34.34 from 47.64, below its yellow line. This rapid fall towards oversold conditions suggests a high degree of downward pressure and no clear signs of reversal for the QNT price.
Decreasing Open Interest Point to Cautious Optimism
However, the trading volume of QNT remains constant at $83.78 million. It is an indication of consistent trading activity in the market. There have been no sudden increases or drops that would affect its trading volume.
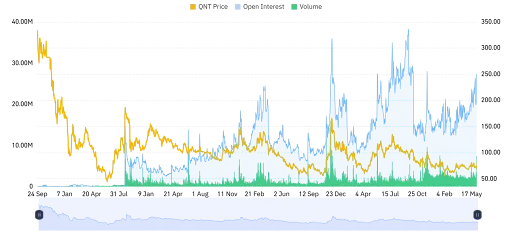

Source: Coinglass
Open interest fell 26.75%, coming down to $20.98 million. It indicates reduced leveraging in futures contracts and low confidence in the market, implying weak momentum or a period of profit-taking in the market.
This article contains market analysis and price predictions. These are not guarantees. Crypto markets are volatile. Always DYOR. Not financial advice.
Also Read: QNT Price Holds Key Support as Bulls Eye Long-Term Recovery Toward $670

Be the first to comment