


Solana price has rebounded more than 10% from its June low after a 36% correction from its May peak, with a giant falling wedge now putting the January high back on traders’ radar.
Summary
- Solana price has stabilized above key support after a steep correction erased roughly one-third of its value in less than two weeks.
- A multi-month falling wedge and a 4-hour ascending triangle point to a potential move toward $76 if $68 resistance breaks.
- Analysts remain cautious, saying a bullish reversal requires a break above $72.57 and a confirmed five-wave advance.
According to data from crypto.news, Solana (SOL) price was trading near $67 on June 12 after rebounding more than 10% from its June 6 low around $61.

SOL’s price recovery follows a steep decline that saw the token plunge roughly 36% from its May high near $96 to its recent bottom, as heavy liquidations, whale selling, and a broader cryptocurrency market sell-off weighed on sentiment.
Data from major exchanges showed retail traders entered June with a strong bullish bias, leaving the market vulnerable when SOL broke below the former support zone around $76. The breakdown triggered more than $89 million in long liquidations, accelerating losses as leveraged positions were forced to close.
Large holders added to the pressure by reducing exposure during the decline. At the same time, weakening decentralized application revenues and softer network activity contributed to the selling pressure, according to market observers.
A falling wedge points to a possible recovery path
The daily chart shows Solana is trading within a large falling wedge that has been developing since its January peak near $145. The pattern formed through a series of lower highs and lower lows, with converging trendlines compressing price action over several months.
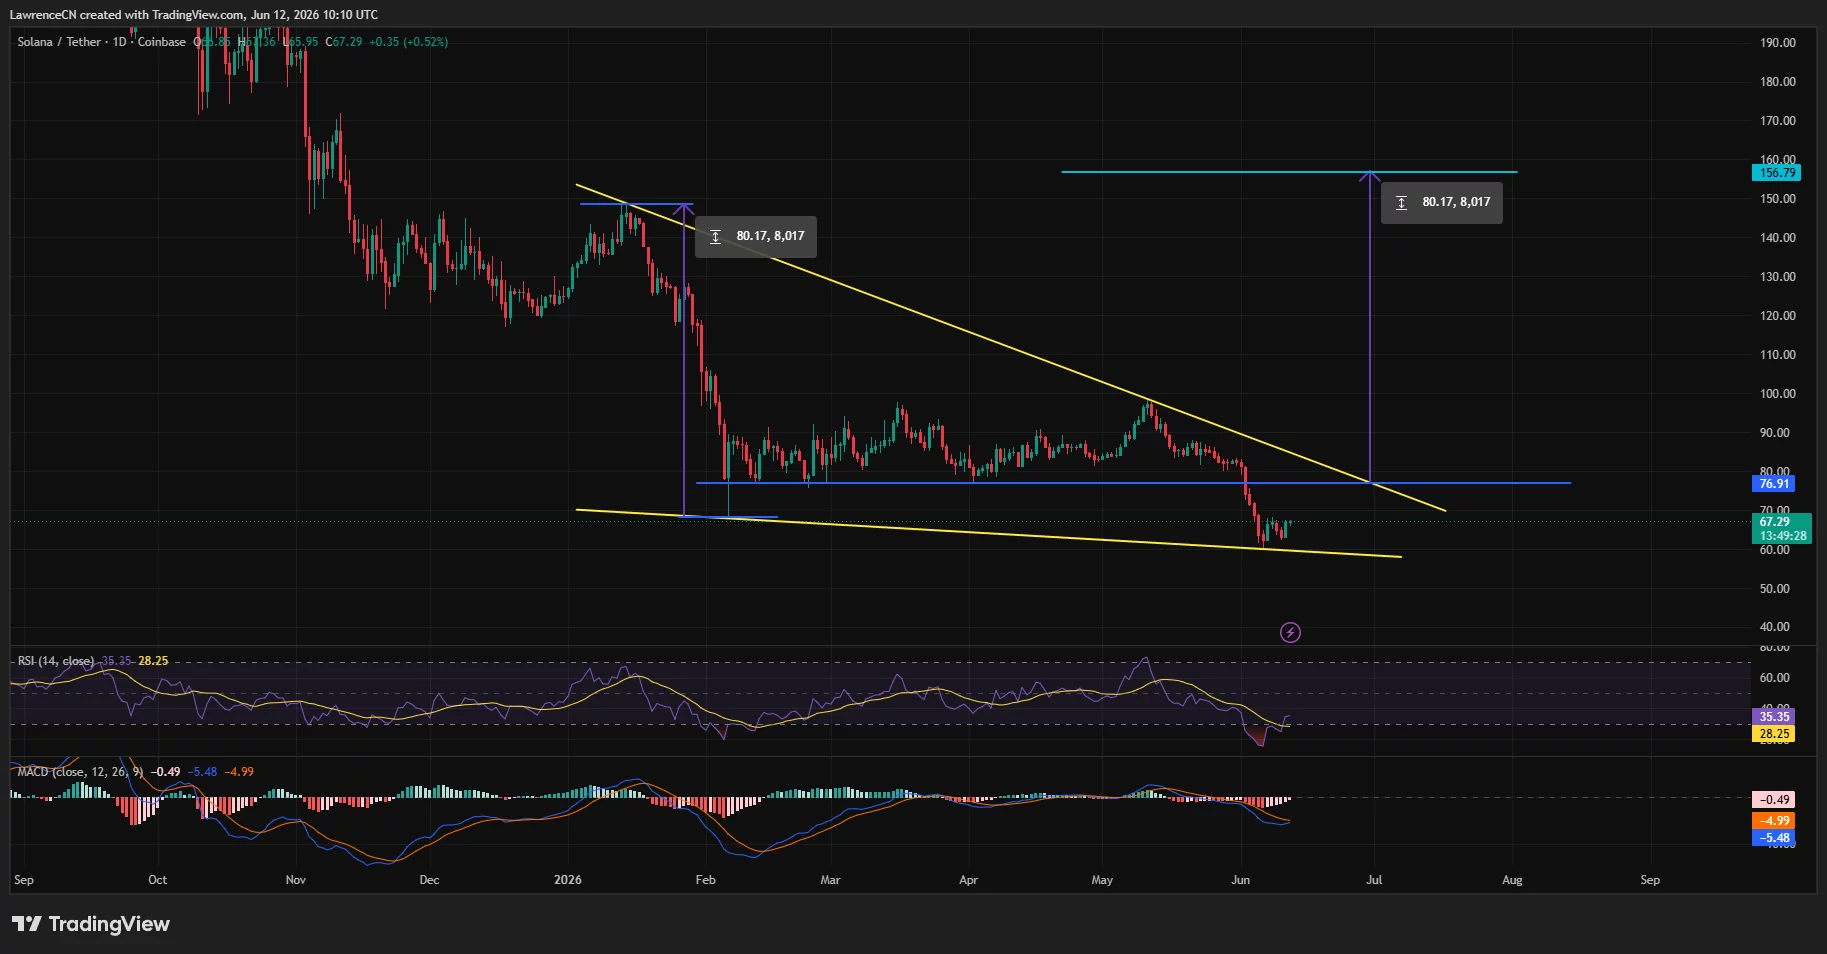
Technical analysts generally view falling wedges as bullish reversal structures when price begins stabilizing near the lower boundary. Solana recently found support around the $60 to $62 region, where buyers stepped in after the liquidation-driven decline.
While the daily trend remains under pressure, the first major hurdle sits near $76. That level previously acted as support before the June breakdown and now represents a significant resistance area. A successful recovery above that zone would place attention back on the upper boundary of the wedge and eventually the January high.
Momentum indicators show early signs of improvement. The daily RSI has recovered from oversold territory, while downside momentum on the MACD has started to ease after weeks of persistent selling.
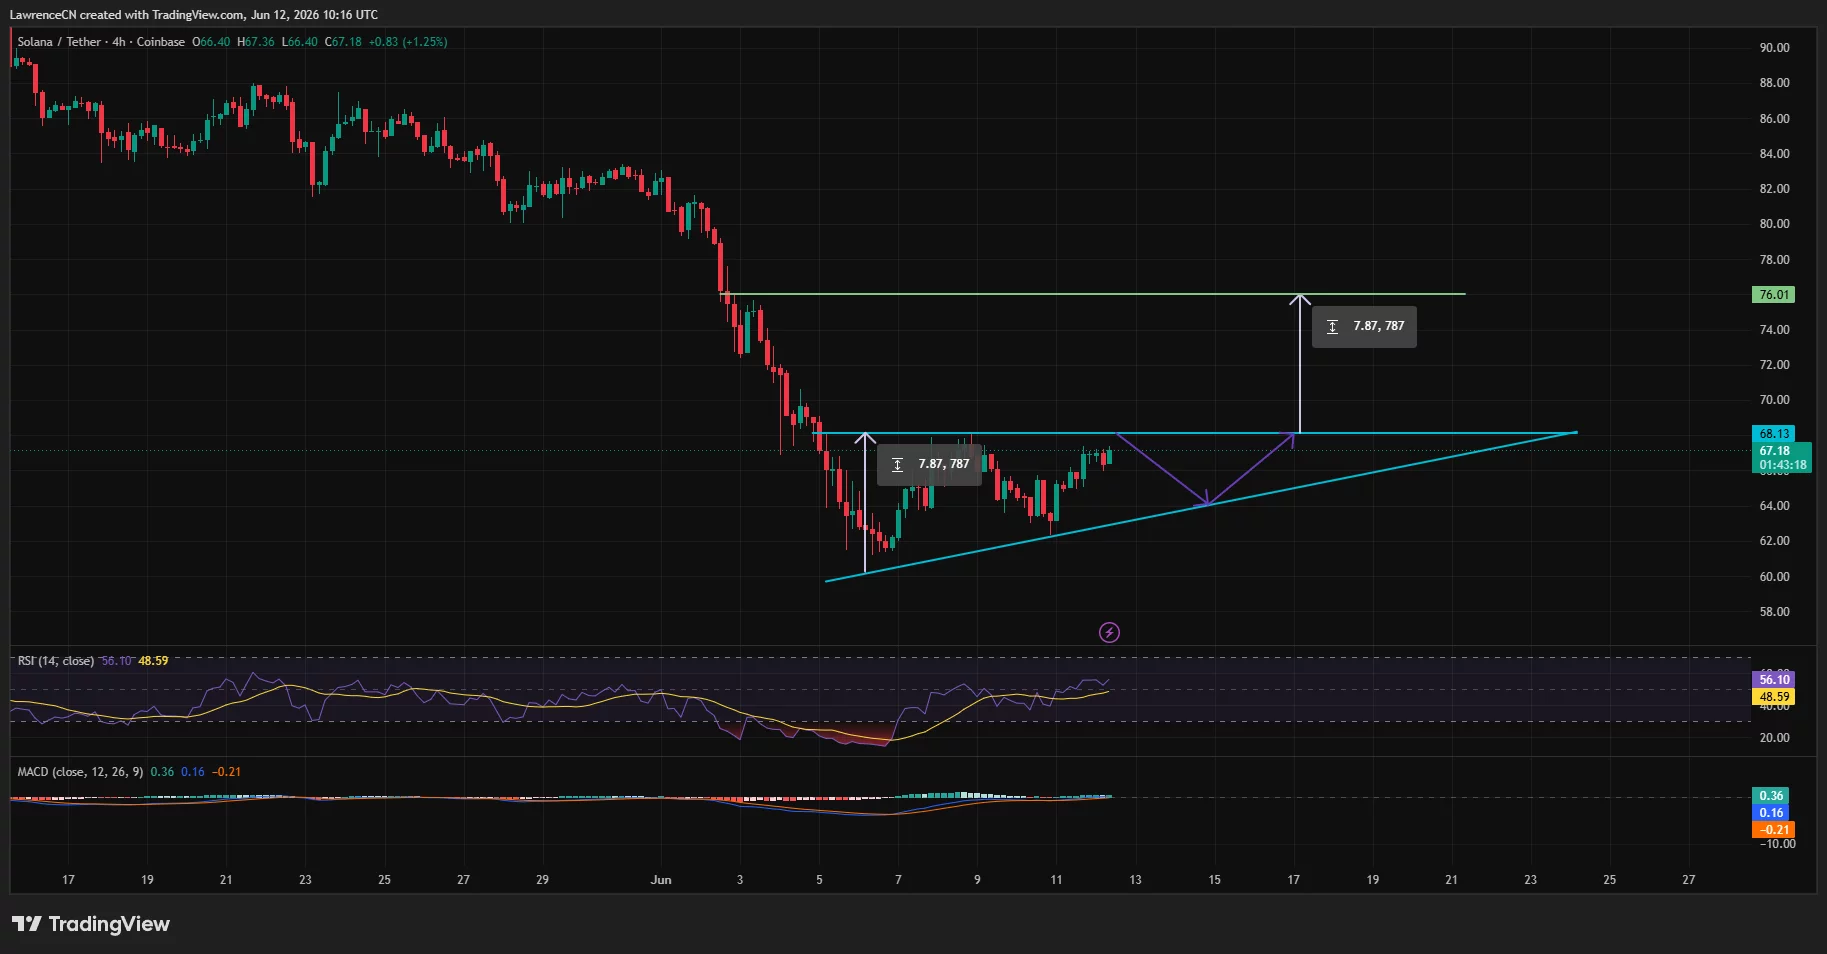
Short-term breakout signals emerge near $68
On the four-hour chart, Solana has formed an ascending triangle beneath resistance around $68. The structure developed after the June low as buyers continued defending higher lows while sellers repeatedly capped advances near the same price level.
Liquidation data from CoinGlass adds another layer to the setup. The platform’s weekly liquidation heatmap shows the largest concentration of short-side liquidity sitting around the $68 area, directly above current price levels.
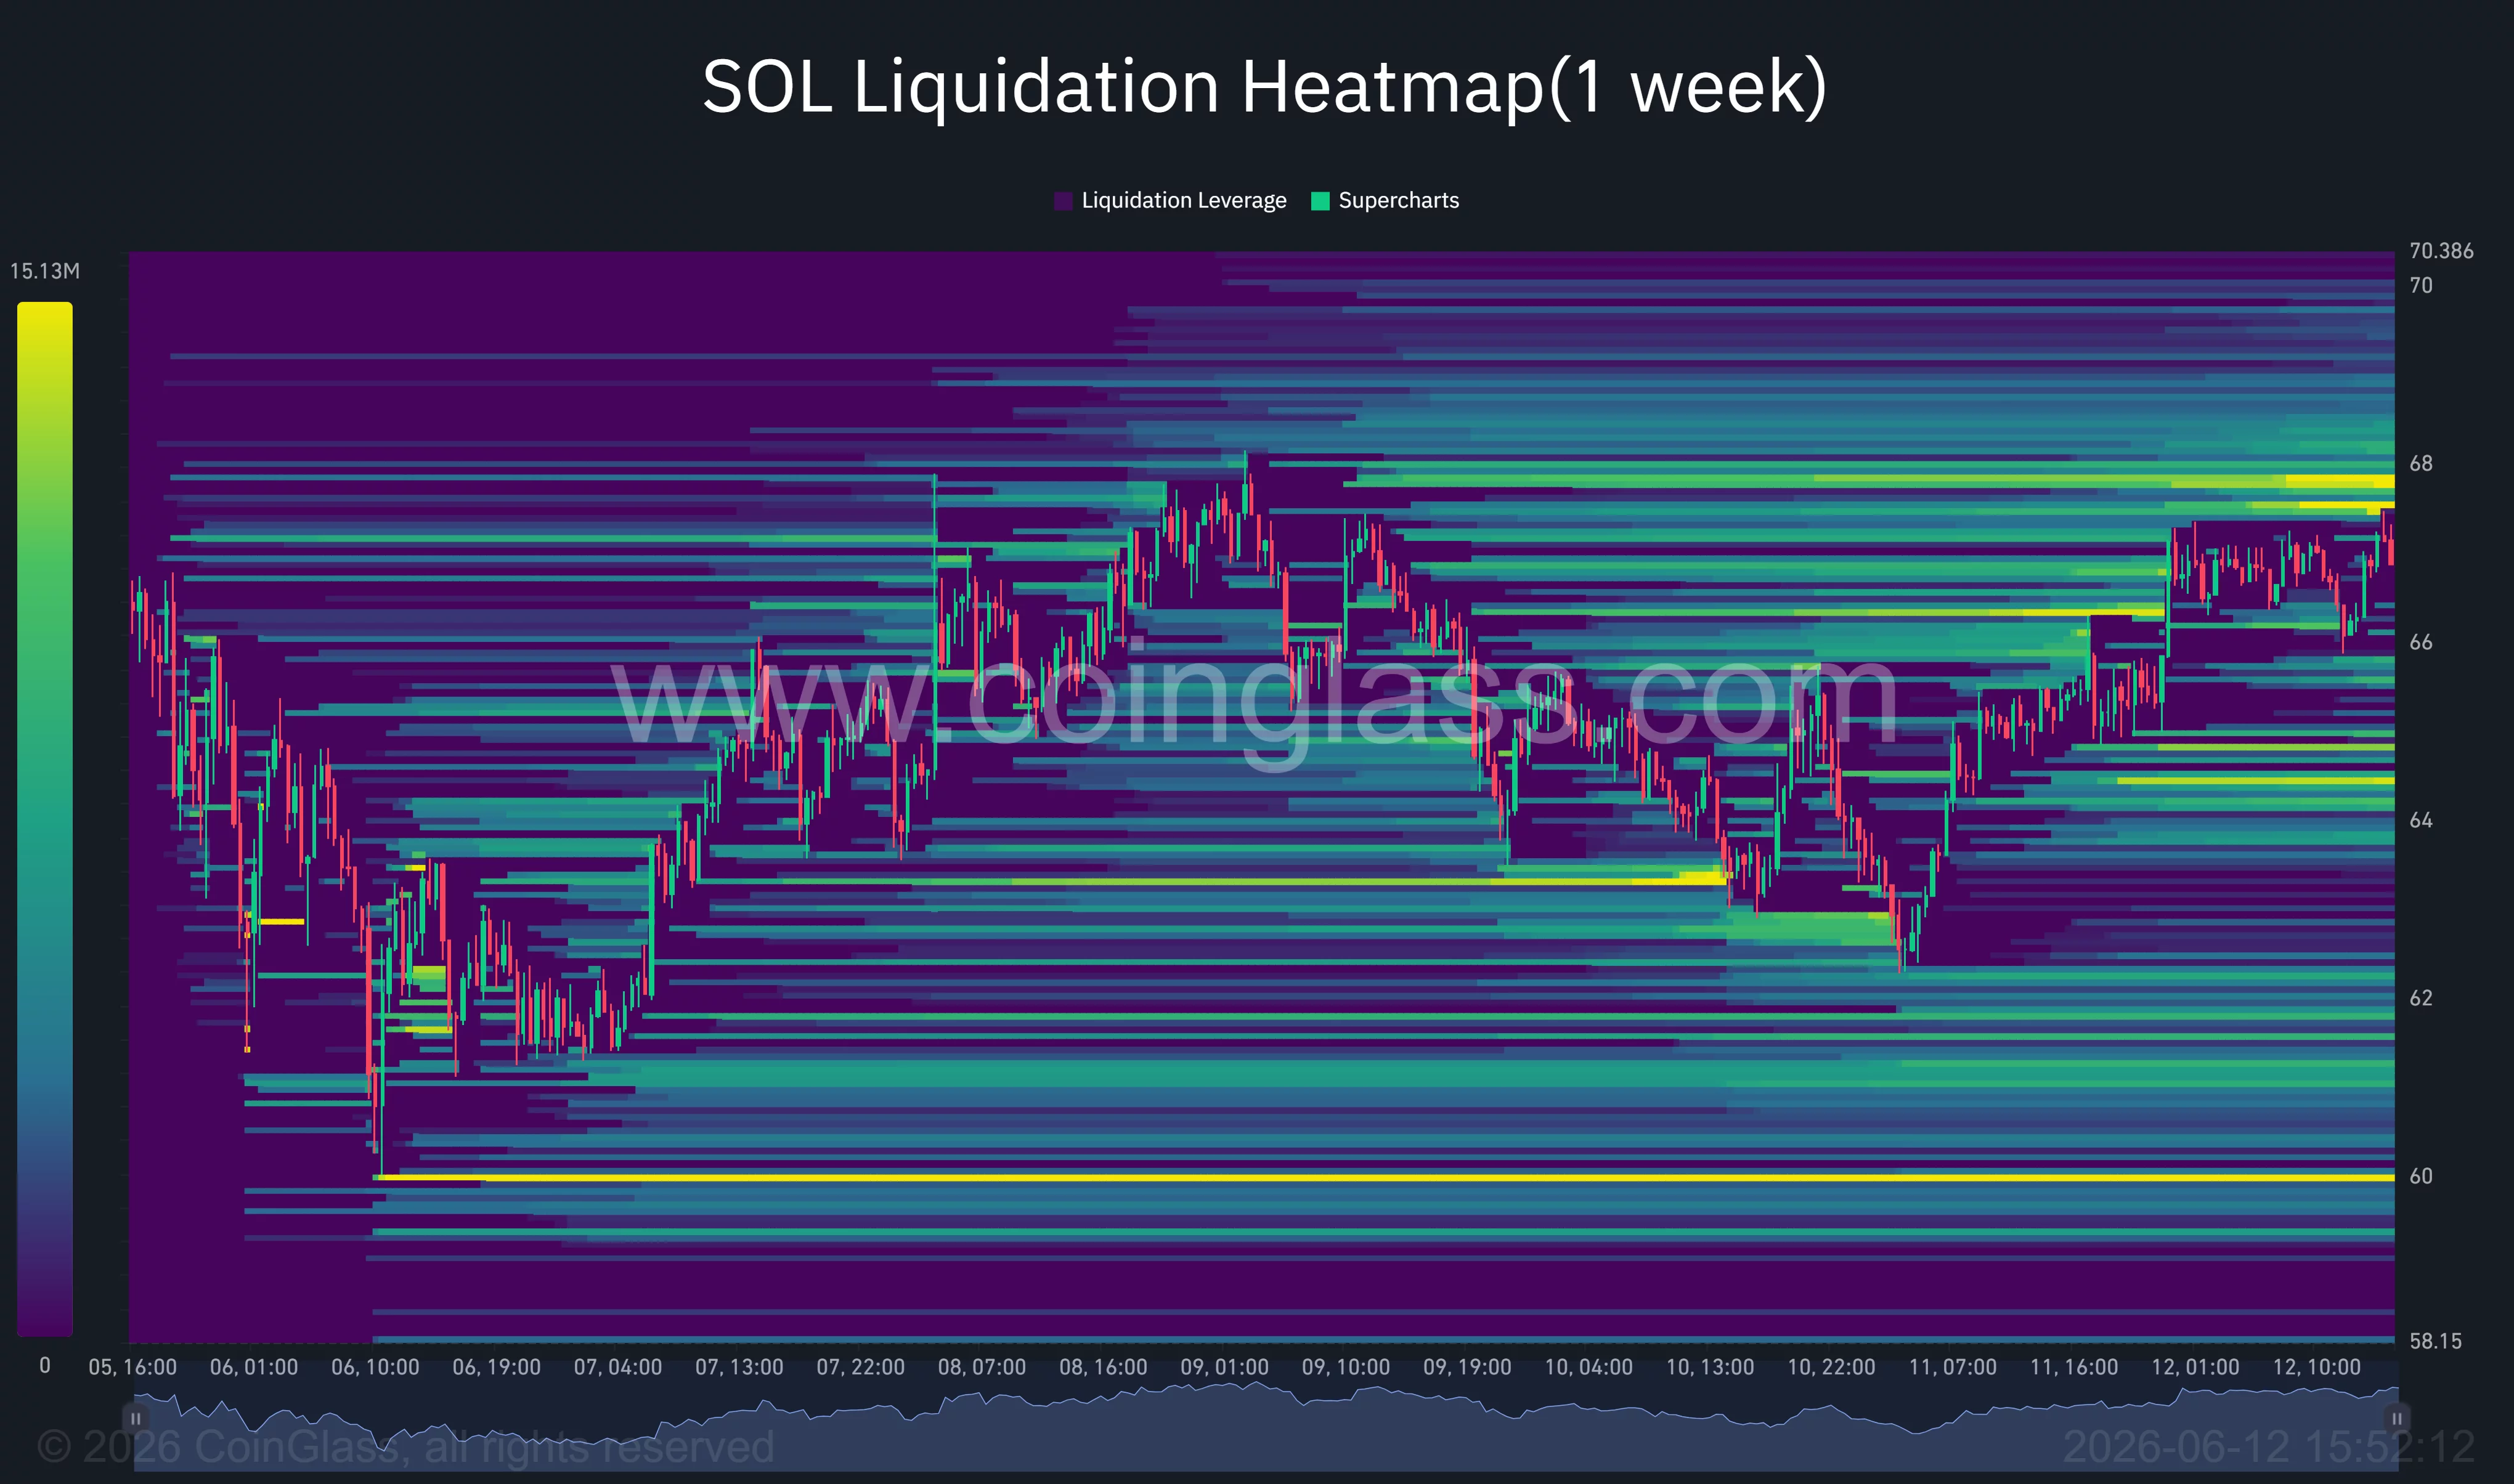
If buyers force a breakout through that resistance, the resulting short liquidations could accelerate upside momentum toward the next liquidity cluster near $70. The measured move from the ascending triangle also projects a target close to $76, aligning with the former support zone that failed earlier this month.
However, not all analysts are convinced the rebound has developed into a full trend reversal. Commenting on the recent price action, MCO Global said on X that Solana is still testing support and has yet to produce a bullish confirmation signal. The analyst noted that the larger decline remains the preferred outlook unless SOL breaks above $72.57.
“Bullish reversal requires a 5-wave advance and a break above $72.57. The chart hasn’t shown that yet. Until it does, this is just support being tested.”
Bitcoin’s recent weakness continues to influence the altcoin market, including SOL, after the largest crypto suffered its sharpest weekly decline since the FTX collapse. Market sentiment also remains tied to U.S. economic data after May nonfarm payrolls increased by 172,000, exceeding expectations of 85,000 and reducing expectations for Federal Reserve rate cuts.
For now, Solana’s recovery attempt depends on whether buyers can clear the $68 resistance zone. A breakout could open the door to $70 and potentially $76, while failure at current levels may leave the $60 support area exposed once again.
Disclosure: This article does not represent investment advice. The content and materials featured on this page are for educational purposes only.

Be the first to comment