


The S&P 500 is priced like profits will stay hot and broad. That’s the setup. This earnings season will test it in real time.
We’ll cut through the noise. You’ll see what growth needs to look like to support a roughly 20x forward multiple, where guidance is trending, which sectors have to carry, and the red flags that usually get missed.
No drama. Just the handful of numbers and tells that actually change the valuation math.

Short version: yes, profit growth could justify record valuations, but only if the beat-and-raise cycle is broad and margins hold up. FactSet’s set-up is strong on paper — double-digit revenue growth feeding 20%+ EPS — yet execution risk is high with rates, AI capex, and currency still moving the goalposts. Expect the market to reward durable cash generation and punish guide-downs fast.
- FactSet projects Q2 S&P 500 EPS growth of 23.1% year over year; revenues +12.3% (FactSet Earnings Insight (PDF)).
- Forward 12-month P/E sits at 20.1, a rich multiple that assumes sustained beats (FactSet Earnings Insight (PDF)).
- Guidance breadth tilts positive: 63 positive vs. 48 negative EPS preannouncements into Q2 (FactSet Insight).
- Watch operating margins, AI-related capex, and FX commentary; they’re the swing factors behind cash flow.
- Leadership concentration risk remains: megacaps can’t carry forever if the middle of the index lags.
What would it take for earnings to validate a 20x forward P/E?
A 20.1 forward P/E implies an earnings yield near 5%. That’s not in a vacuum. Investors can get a decent yield in bonds today, so equities need either faster growth, safer cash flows, or both to justify the premium. In practice, that means repeated beats and guidance that doesn’t wobble when macro headlines do.
FactSet’s current backdrop helps the bull case: analysts see Q2 EPS up 23.1% with sales up 12.3% year over year (FactSet Earnings Insight (PDF)). If that revenue-to-earnings conversion rate sticks, the multiple can be defended. If it’s a margin mirage — one-time tax items, cost deferrals, inventory accounting — then the market will squint hard at the quality of the beats.
One more thing: concentration. If a thin slice of megacaps prints monster numbers while the other 450 stocks struggle, the index’s headline multiple can stay high, but fragility rises. The market usually gives that a pass in the short run and then demands breadth when the cycle matures.
Are revenue trends broad or just megacap magic?
Revenue is the cleanest tell. It’s harder to manufacture than EPS. The FactSet setup for Q2 is solid at +12.3% sales growth for the index (FactSet Earnings Insight (PDF)), suggesting demand isn’t just a cost-cutting story.
But breadth matters. Over the past few quarters, big platform companies have been able to grow through cycles thanks to pricing power, cloud adoption, and AI tailwinds. The rest of the market hasn’t always kept pace. This season, listen for mid-cap industrials and services firms talking about backlog stability, order intake, and price realization. If they’re still lifting prices without big volume pushback, the demand picture is healthier than the “it’s all AI” narrative.
Currency and regional mix can distort this. A stronger dollar tends to shave multinationals’ revenue growth. Companies will call this out in their bridges; the trick is separating translation headwinds from real demand trends. If constant-currency growth is strong while reported is soft, that’s far better than the reverse.
How fragile are margins if costs stay sticky?
Margins did a lot of the lifting in the last cycle. Companies cut fat, automated workflows, renegotiated supply, and rode price increases longer than expected. That playbook isn’t endless. Wages, freight, and energy are all still volatile. If companies need to spend heavily on AI infrastructure and software licenses to keep up, near-term operating leverage can actually compress even as demand is fine.
What to look for: gross margin versus operating margin. Gross can look healthy thanks to mix and input costs normalizing, but operating margin may sag if R&D and opex jump. Management teams will frame this as “investment mode.” That’s fine as long as the spend is tied to revenue growth or cost savings with believable payback periods.
Cash conversion bridges will tell you if margin headlines are real. If net income is up but operating cash flow lags because receivables ballooned or inventory spiked, quality is suspect. One quarter isn’t a verdict; a pattern across two or three quarters is.

What are the telltales in company guidance this quarter?
Into the season, guidance skewed positive: 63 positive vs. 48 negative EPS preannouncements, per FactSet as of July 2, 2026 (FactSet Insight). That’s decent breadth. The market will want confirmation in the actual calls.
Most investors don’t read every slide. A quick checklist keeps you honest when the narrative on TV sounds rosy:
- Does the company raise full-year revenue guidance, not just EPS?
- Are margin targets lifted on both GAAP and non-GAAP bases?
- Is capex rising for clear growth projects with stated ROIC targets?
- Any shift in buyback pace or dividend that hints at confidence (or caution)?
- What’s the language on order backlogs, cancellations, and pricing power?
- Are FX and commodity assumptions realistic versus current spot ranges?
Lastly, watch the Q&A, not just prepared remarks. If management dodges simple questions about demand by region or segment, that’s usually a tell that visibility is fuzzy.
Which sectors have to carry the print, and what could surprise?
Every season, a few sectors do the heavy lifting. The market is still leaning on tech-adjacent groups to turn revenue into EPS, while cyclicals need to show that higher rates and stickier costs aren’t eroding orders. Surprises often come from the boring middle — services, select industrial niches, and healthcare subsegments where pricing or mix quietly improves.
Here’s a simple lens to frame expectations without pretending to be a sector PM:
| Sector | Earnings Setup | Risk to Watch | Possible Upside |
|---|---|---|---|
| Information Technology | AI, cloud, and automation still tailwinds; backlog visibility decent | Capex digestion by customers; pricing pressure in commoditized hardware | Stronger software renewal cycles; better-than-feared AI monetization |
| Communication Services | Advertising and platforms rebounding with targeted spend | Ad budgets if macro jitters return; regulatory headlines | Ad pricing resilience; subscription ARPU lift |
| Consumer Discretionary | Resilient upper-income spend; promotions normalize | Credit normalization; inventory missteps | Private-label mix benefits margins; better conversion online |
| Industrials | Backlogs support revenue; supply chains steadier | Project delays; labor availability | Pricing discipline holds; services revenue mix expands |
| Financials | Stable credit trends; fees matter more than spread | Funding costs; regulatory capital changes | Efficiency gains; buybacks resume where permitted |
| Energy | Commodity prices drive prints | Volatile benchmarks; policy headlines | Cost discipline; midstream stability |
| Health Care | Defensive demand; mix shifts in services and therapeutics | Pricing scrutiny; pipeline execution | Procedure volumes beat; margin recovery in managed care |
Broadly, the index needs tech and comm services to keep doing the obvious, and for at least two of industrials, discretionary, and health care to surprise positively on margins. If energy behaves and doesn’t drag, even better.
How do buybacks, capex, and cash flows change the valuation math?
Valuation is not just a P/E debate. Free cash flow yield, buyback velocity, and capex intensity matter as much. A company that prints strong FCF can support a higher multiple even if GAAP EPS is noisy.
Buybacks quietly shape earnings season. Lower share counts boost EPS, but the more important signal is management’s willingness to return cash when the stock is near highs. If boards keep authorizing repurchases, it’s a vote of confidence in the durability of cash flows. If they pivot to heavier capex without explaining paybacks, the market will discount near-term EPS and wait for proof.
Infrastructure spending is the elephant. Infrastructure spending is big and lumpy. That can suppress free cash flow in the near term. The key question isn’t “how much are you spending?” It’s “what revenue or cost line moves because of it, and when?” Seasoned teams will attach time-bound targets to these investments.
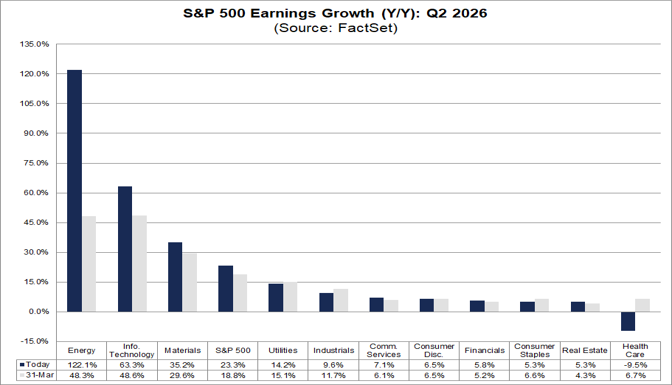
FactSet chart showing S&P 500 and sector‑level year‑over‑year earnings growth for Q2 2026 — highlights how Energy and Information Technology are driving most of the index’s expected earnings gains, which is central to judging whether profit growth justifies current valuations. — Source: FactSet (Earnings Insight / Insight article)
What could break the narrative between now and guidance season end?
Earnings seasons don’t happen in a vacuum. A spiky inflation print, a jolting policy headline, or a currency move can yank the conversation. If rates back up, even great beats can get faded as the discount rate does its thing. If they ease, misses sometimes get forgiven.
There’s also corridor risk inside earnings calls. One poorly phrased answer about demand, a surprise inventory write-down, or an “over-earning” admission can knock 10% off a stock before the CFO gets to slide 15. That’s how tight the tape is when valuations are full.
Pro tip: Track guidance language, not just numbers. A small raise paired with softer phrasing about “uncertainty” is often a stealth downgrade for the next quarter.
Finally, keep an eye on sectors that live and die by external prices — energy and materials — and companies with heavy international exposure. FX and geopolitics can hijack an otherwise clean quarter.
Common Mistakes
- Chasing EPS beats without checking cash flow. Avoid celebrating EPS upgrades that aren’t matched by operating cash flow or that rely on working-capital swings.
- Ignoring guidance quality. A raise with widened ranges or hedged language often isn’t a real raise. Read the words.
- Confusing one-time items for margin expansion. Strip out tax credits, asset sales, and restructuring benefits before calling it “core.”
- Forgetting currency math. Constant-currency growth tells you demand; reported can be noise when FX whipsaws.
- Overweighting megacap prints. Great numbers from a handful of giants don’t fix weak breadth if mid-cap cyclicals are rolling over.
- Assuming AI spend is automatically accretive. Demand the bridge: how, when, and where does the investment pay back?
If you want a steady pulse on how macro, equities, and digital assets cross-pollinate during earnings season, we track that blend daily at Crypto Daily.
Frequently Asked Questions
Does a 23.1% EPS growth estimate mean valuations are safe?
Not automatically. It’s a strong starting point, but the market needs confirmation via beats, raised guidance, and cash flow follow-through. The 20.1 forward P/E assumes more than one good quarter (FactSet Earnings Insight (PDF)).
How much do preannouncements matter if they’re mixed?
The balance of 63 positive vs. 48 negative preannouncements suggests modest tailwinds (FactSet Insight). The market still waits for full guidance on calls, especially around margins and capex.
What if revenue growth is strong but margins slip?
That’s usually fine if the margin dip is tied to clear growth investments with defined paybacks. If margins fall because pricing power is fading or costs are running hot, the multiple will get questioned quickly.
Can buybacks alone keep the index multiple elevated?
They help EPS optics and signal confidence, but buybacks can’t mask weak demand forever. Without real revenue and cash flow growth, the support fades.
Which single line item moves stocks the most on print day?
Forward guidance. Beats get sold if the outlook is cautious. Misses get bought if guidance resets cleanly and cash flow looks durable.
How should I treat constant-currency metrics?
Use them to judge demand. If constant-currency trends are healthy, reported FX headwinds are usually transient unless there’s a persistent currency shift that changes competitiveness.
Where does this leave cyclicals?
They don’t need perfection, just stability. If orders and pricing hold while costs moderate slowly, cyclicals can surprise positively even with a high index multiple.
Disclaimer: This article is provided for informational purposes only. It is not offered or intended to be used as legal, tax, investment, financial, or other advice.


Be the first to comment