



- SUI trades at $0.7621, down 2.29%, sitting well below all its EMAs in an ongoing downtrend
- SUI/BTC chart shows a bullish divergence across multiple timeframes, per analyst CryptoMichNL
- SUI ETFs have posted 12 consecutive weeks of net inflows, adding 9.3M+ tokens since June
SUI keeps falling on the daily chart even as a longer-term signal against Bitcoin looks increasingly bullish. That gap between short-term price action and longer-term momentum is the story right now.
SUI Price Analysis: Downtrend Intact, But a Divergence Is Building Underneath
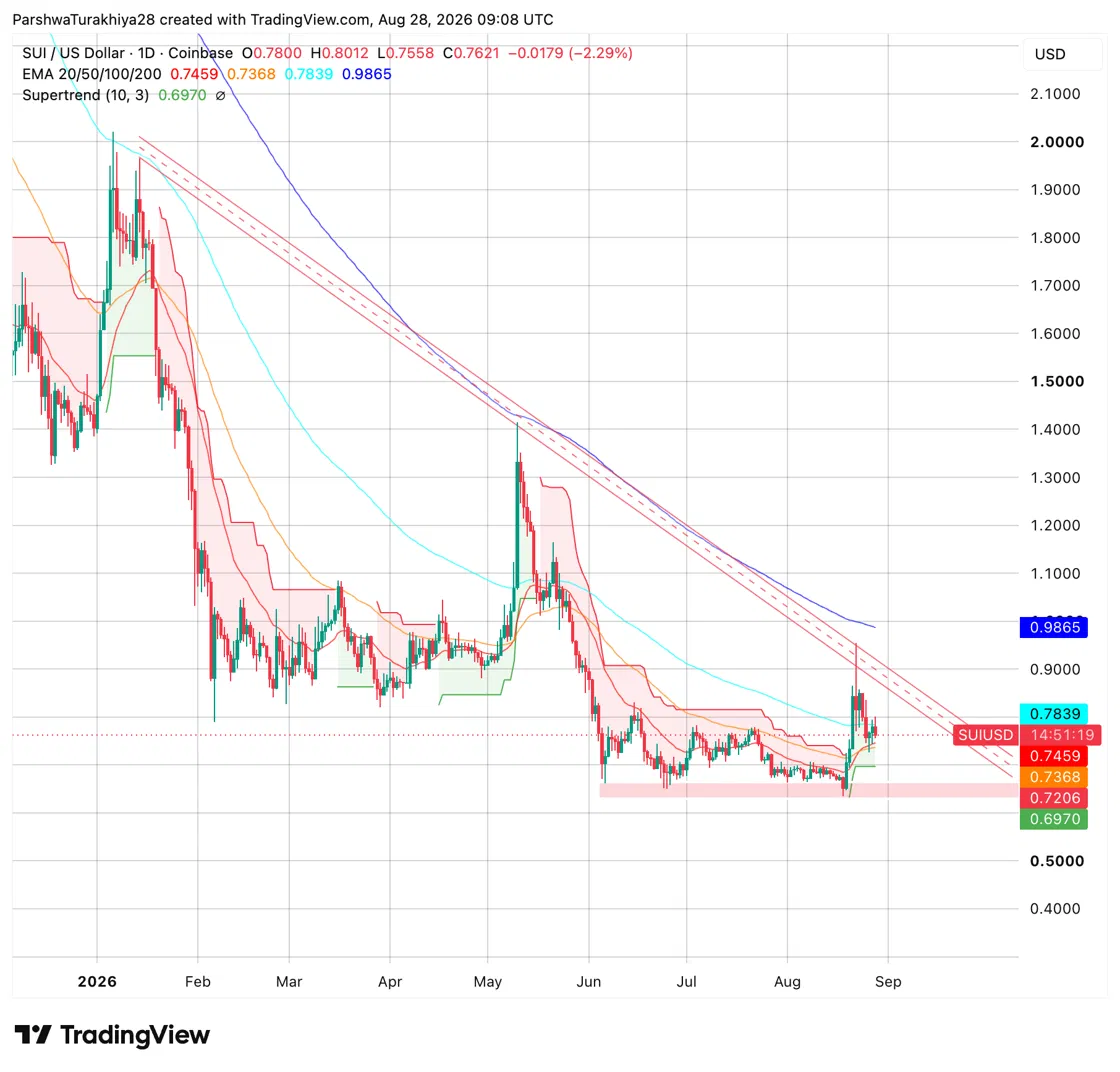
SUI Price Analysis (Source: TradingView)
SUI trades at $0.7621, well below all its EMAs: the 20-day at $0.7459, 50-day at $0.7368, 100-day at $0.7839, and 200-day at $0.9865. The descending Supertrend channel from May’s highs remains fully intact, and price has spent the past month chopping around $0.70 to $0.80 without a clean breakout.

The more interesting signal is on the SUI/BTC chart. Analyst CryptoMichNL flagged a falling wedge pattern with a bullish RSI divergence, price made lower lows since May while RSI made higher lows, a setup that historically precedes reversals. He noted the same divergence pattern showed up at Bitcoin’s own recent low and across several altcoin charts.
September 2026 Weekly Forecast
| Period | Price Range | Key Level | Scenario |
| Sept 1-10 | $0.70 – $0.84 | $0.7839 (100-day EMA) | Range-bound unless BTC dominance drops |
| Sept 11-20 | $0.68 – $0.90 | $0.84 breakout zone | Rotation from BTC could trigger a move |
| Sept 21-30 | $0.65 – $0.95 | Phantom wallet deadline (Sept 24) | Volatility likely around unlock and migration deadline |
SUI News: ETF Inflows Extend to 12 Straight Weeks
Analyst Ali Martinez reported on August 25th that SUI ETFs have posted 12 consecutive weeks of net inflows, accumulating more than 9.3 million tokens since June, an unusually consistent streak for a mid-cap asset.
Separately, 21Shares updated its prospectus for TSUI, its spot SUI ETF, reporting $13.3 million in assets under management, with a benchmark switch planned for August 31.
SUI News: Network Activity Hits a 90-Day High
Sui processed more than 8.5 million transactions on August 22, its highest daily transaction count in 90 days, coinciding with the broader market recovery.
That’s a meaningful pickup in raw usage. But DeFi TVL on Sui still sits near $469 million, roughly 82% below its 2025 peak of $2.58 billion, showing that while people are transacting more on the network, the money actually locked into Sui’s DeFi ecosystem hasn’t followed at the same pace yet.
SUI News: Phantom Wallet Ends Sui Support September 24
Phantom will stop supporting the Sui network entirely on September 24, 2026. After that date, Phantom users won’t be able to view, send, swap, or interact with Sui assets through the app.
Nothing gets lost though, assets remain on the Sui blockchain and stay fully accessible through other compatible wallets like Slush, the Sui Foundation’s recommended option. Phantom has waived swap fees for converting native SUI to wrapped SUI on Solana through the transition date, giving affected users a free path to migrate before the deadline hits.
Michaël van de Poppe: Liquidity Rotation Could Favor Altcoins
Analyst Michaël van de Poppe said SUI’s BTC chart “looks absolutely horrible” but expects that to change, pointing to the same bullish divergence pattern and arguing that once Bitcoin consolidates, liquidity typically rotates into altcoins next.
SUI Price Prediction: Upside and Downside Targets
Bullish Case, Target: $0.84
SUI holds above $0.70 and the bullish divergence on SUI/BTC plays out as BTC consolidates, pulling liquidity into altcoins. Continued ETF inflows and rising network activity support a push toward $0.84 resistance.
Bearish Case, Risk Level: $0.6970 (Supertrend)
Monthly unlocks (~64M SUI) keep adding sell pressure faster than ETF demand can absorb it, and the divergence fails to confirm with price. SUI breaks the Supertrend level and slides toward the low $0.60s.
FAQ: SUI Price Prediction
What is the SUI price prediction for September 2026?
SUI trades at $0.7621, below all its EMAs in an ongoing downtrend. The September forecast ranges from $0.70 to $0.95 depending on the window, with $0.84 as the bullish target and $0.6970 at the Supertrend as the bearish risk level.
What is the bullish divergence analysts are flagging on SUI/BTC?
It’s a falling wedge pattern paired with a bullish RSI divergence, where price keeps making lower lows while RSI momentum makes higher lows, a setup analyst CryptoMichNL says has historically preceded reversals and recently showed up at Bitcoin’s own low.
Are SUI ETF inflows still growing?
Yes. SUI ETFs have posted 12 consecutive weeks of net inflows, adding more than 9.3 million tokens since June, an unusually consistent streak for a mid-cap asset.
What happens to my SUI if I use Phantom wallet after September 24?
Nothing about your SUI itself changes. Phantom will stop supporting Sui network interactions after that date, but your assets remain fully accessible through other compatible wallets like Slush, and Phantom has waived swap fees for converting to wrapped SUI on Solana through the deadline.
Why hasn’t Sui’s DeFi activity grown despite rising network usage?
Sui processed a 90-day high of 8.5 million transactions on August 22, but DeFi TVL on the network still sits about 82% below its 2025 peak, meaning more people are transacting on Sui without a proportional amount of money being locked into its DeFi ecosystem yet.
Is SUI a good buy right now?
SUI is showing a genuine split between weak short-term price action and a longer-term bullish signal against Bitcoin, with real catalysts and real risks landing in the same month of September. This is not financial advice, so weigh the bullish and bearish cases above against your own research and risk tolerance.
Conclusion
September is shaping up to be the month that settles which signal was right: the daily chart that’s been grinding lower for a month, or the SUI/BTC divergence that’s been quietly building the whole time. Those two aren’t actually in conflict the way they first appear, a divergence like this is specifically a leading indicator, meaning it’s supposed to show up before price confirms it, not alongside it.
The catalysts stacking into the back half of the month, a possible Bitcoin-driven rotation and the Phantom migration deadline, make September a genuinely higher-stakes window than the current $0.70 to $0.80 chop suggests on its own.
Disclaimer: The information presented in this article is for informational and educational purposes only. The article does not constitute financial advice or advice of any kind. Coin Edition is not responsible for any losses incurred as a result of the utilization of content, products, or services mentioned. Readers are advised to exercise caution before taking any action related to the company.



Be the first to comment