


What to know:
- UNI consolidates in a descending triangle, with strong support holding while lower highs signal price compression.
- Momentum weakens as UNI trades near the 20-day MA, with MACD flattening and showing slowing buying pressure.
- Buyers defend key support, suggesting accumulation that could precede a larger move in UNI price
Uniswap is consolidating in a descending triangle with strong support defense but lower highs compressing price action. Technical indicators show weakening momentum as the UNI price holds the 20-day MA after a pullback and MACD flattens. Derivatives data also indicates reduced participation and cautious sentiment. According to CoinMarketCap, UNI is trading at $3.46 with a daily decline of 5.91%.
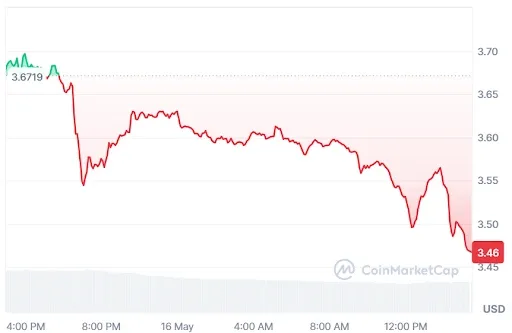

Source: CoinMarketCap
UNI Derivative Data Point to Cautious Optimism
According to Coinglass, the UNI open interest decreased by 6.81%, reaching $190.66 million, indicating reduced trader exposure in active contracts. This decline suggests lower market commitment, possible position unwinding, and weakening confidence in short-term direction across derivatives markets.


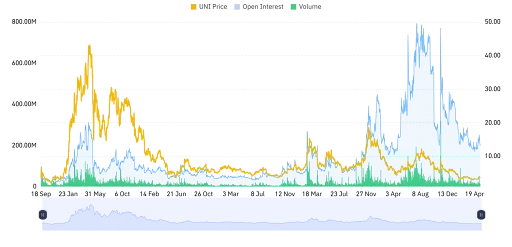
Source: Coinglass
Trading volume fell by 1.90%, totaling $201.79 million, reflecting reduced market activity and participation. This slowdown suggests weaker momentum, lower transaction frequency, and cautious trading behavior among participants, potentially indicating short-term consolidation or reduced volatility in the market.
Also Read: Uniswap (UNI) Price Eyes $6 Rally After Trendline Resistance Breakout
UNI Price Setup Points to a Breakout Toward $25
Furthermore, the crypto analyst Butterfly highlighted that the UNI price is contained in a declining triangle on a two-week chart with a very important horizontal area of support, which the bulls continuously defend.
The retracement of price to the support level sees very strong buy pressure, which consumes the sell-off pressure, despite lower highs being formed and the narrowing range


Source: Butterfly’s X Post
In the event that support stands firm and the UNI price bounces off, momentum may change direction quickly as shorts take profits and buyers start trading in the market.
A breach of the descending trendline will lead to an impressive growth period, setting the stage for further resistance levels. With this bullish scenario, the UNI price will move towards $25 if strength continues.
Technical Indicators Point to Cautious Optimism
According to TradingView, the UNI price has spent a long time in consolidation, stuck between $3.05 and $4.30 following a dramatic fall early in the year.
An outburst of hope in May saw prices rise close to the top Bollinger Band, but the UNI price retreated to $3.46820. The UNI price currently finds itself struggling to hold onto the crucial 20-day moving average level of $3.48499.

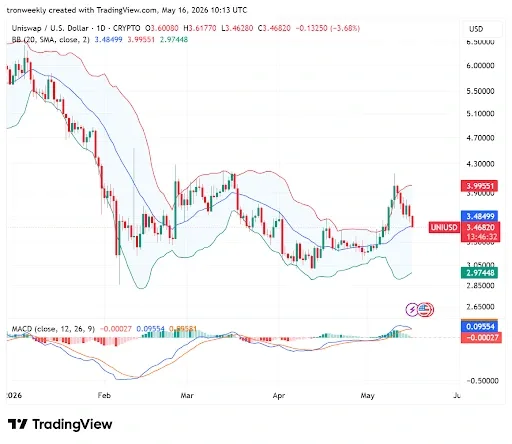
Source: TradingView
Additionally, the MACD indicator also reflects this shift in momentum. Following a gradual uptrend from its low in February, the MACD line turned positive in May with increasing histogram bars.
However, the blue MACD line now seems to be stabilizing and turning towards the orange line, indicating a waning demand for the UNI.
This article contains market analysis and price predictions. These are not guarantees. Crypto markets are volatile. Always DYOR. Not financial advice.
Also Read: Uniswap Rally Strengthens: Can UNI Price Surge to $50 Amid DeFi Revival?

Be the first to comment