



As the asset battles beneath a dense cluster of technical resistance, XRP is once again putting investors’ patience to the test. Earlier this week, sellers regained control after a brief attempt to break higher, pushing the token back below a crucial triangle breakout level and leaving bulls looking for new momentum.
XRP’s dynamic resistance
As of this writing, XRP is trading close to $1.08, which is below the 50-day and 100-day moving averages but slightly above local support. These indicators, which are currently converging around the $1.10 level, have consistently thwarted attempts at recovery throughout July and continue to function as dynamic resistance.
The most recent price movement demonstrates how limited XRP’s trading range has become. Over the past few weeks, a symmetrical triangle had developed, indicating that volatility was contracting before a bigger move. However, XRP fell below the pattern’s rising support rather than staging a sustained breakout, indicating that sellers are still prepared to defend higher prices.

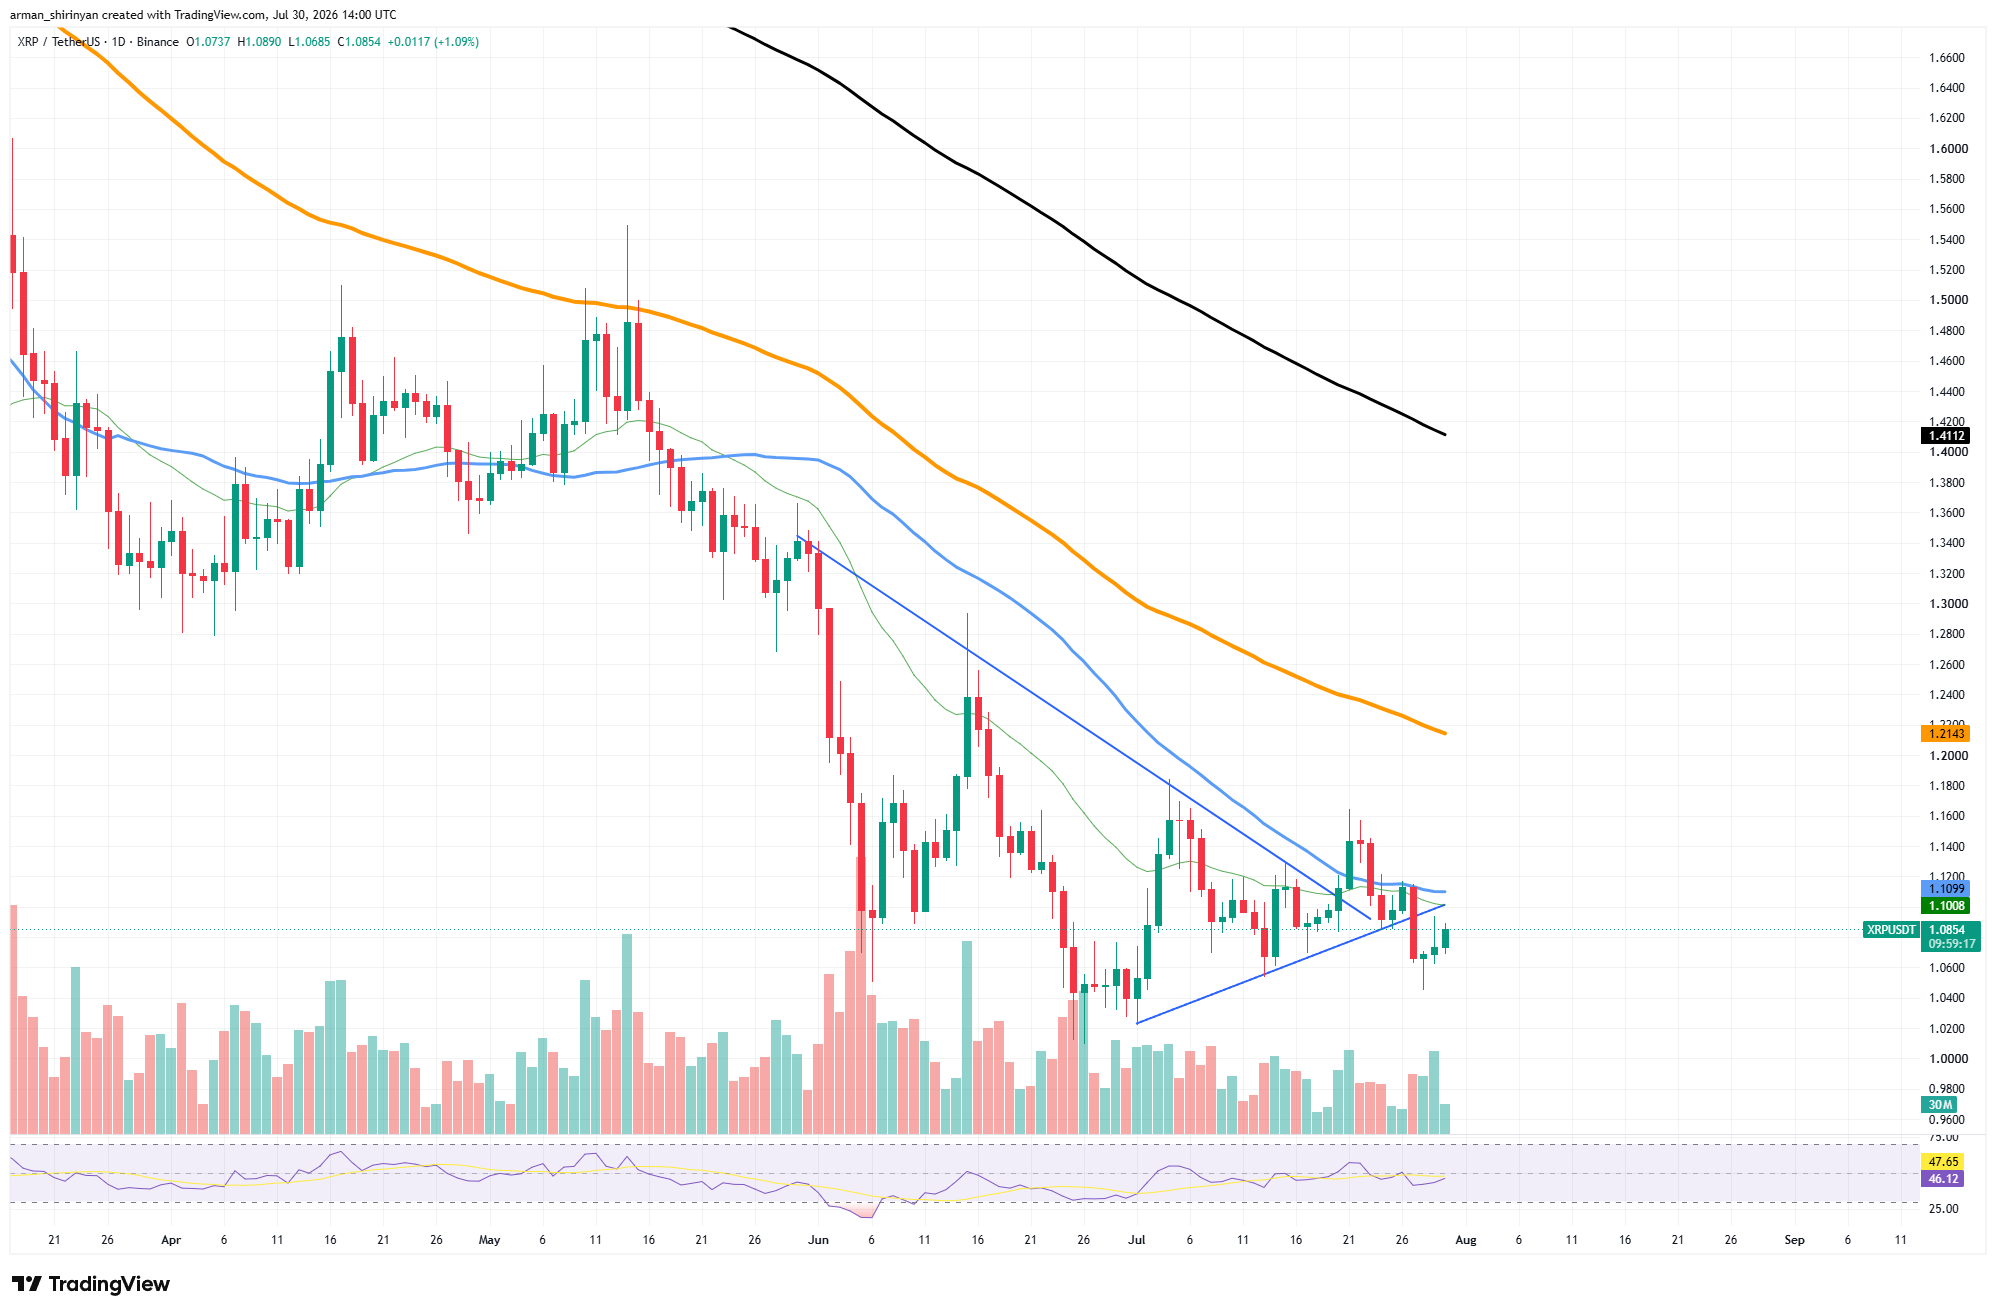
Additionally, the general trend still favors caution. XRP is still trading below all of the major long-term resistance levels, as the 200-day moving average remains much higher at $1.21. The market will probably continue to see rallies as corrective rather than the start of a new bullish trend until those moving averages begin to flatten or turn upward. Currently, trading volume is not very encouraging.
Buyers have not yet committed enough capital to absorb the ongoing selling pressure around resistance, as evidenced by the relatively muted activity during recent rebound attempts. For XRP to break out of its current range, higher volume will probably be needed.
You Might Also Like

The Relative Strength Index is currently at 46, just below the 50-point neutral threshold. This indicates that while bearish momentum has diminished significantly compared to June’s decline, it has not vanished. The short-term outlook would be improved by a return above 50, especially if it were accompanied by a break above the moving-average cluster. The most significant resistance is still found between $1.09 and $1.10 for the time being.
In addition to putting XRP back above the 50-day and 100-day moving averages, a strong daily close above that range could pave the way for a challenge to the 200-day moving average around $1.21. Support around $1.05 remains crucial on the downside. If that level were lost, the psychologically significant $1.00 mark would probably come into focus.
Zcash’s stabilization attempt
After a two-week correction, Zcash is trying to stabilize, and the technical setup indicates that a recovery toward the $500 mark is still possible if buyers continue defending the current support. ZEC is displaying signs that selling pressure may be easing, despite the fact that momentum has decreased since July’s peak.
After recovering from a significant moving average confluence, ZEC is currently trading at about $476. While the 100-day moving average continues to offer additional support in the $474 region, the asset momentarily fell below the 50-day moving average before swiftly reclaiming it. Despite the recent decline, the medium-term recovery structure remains intact if both indicators are maintained.
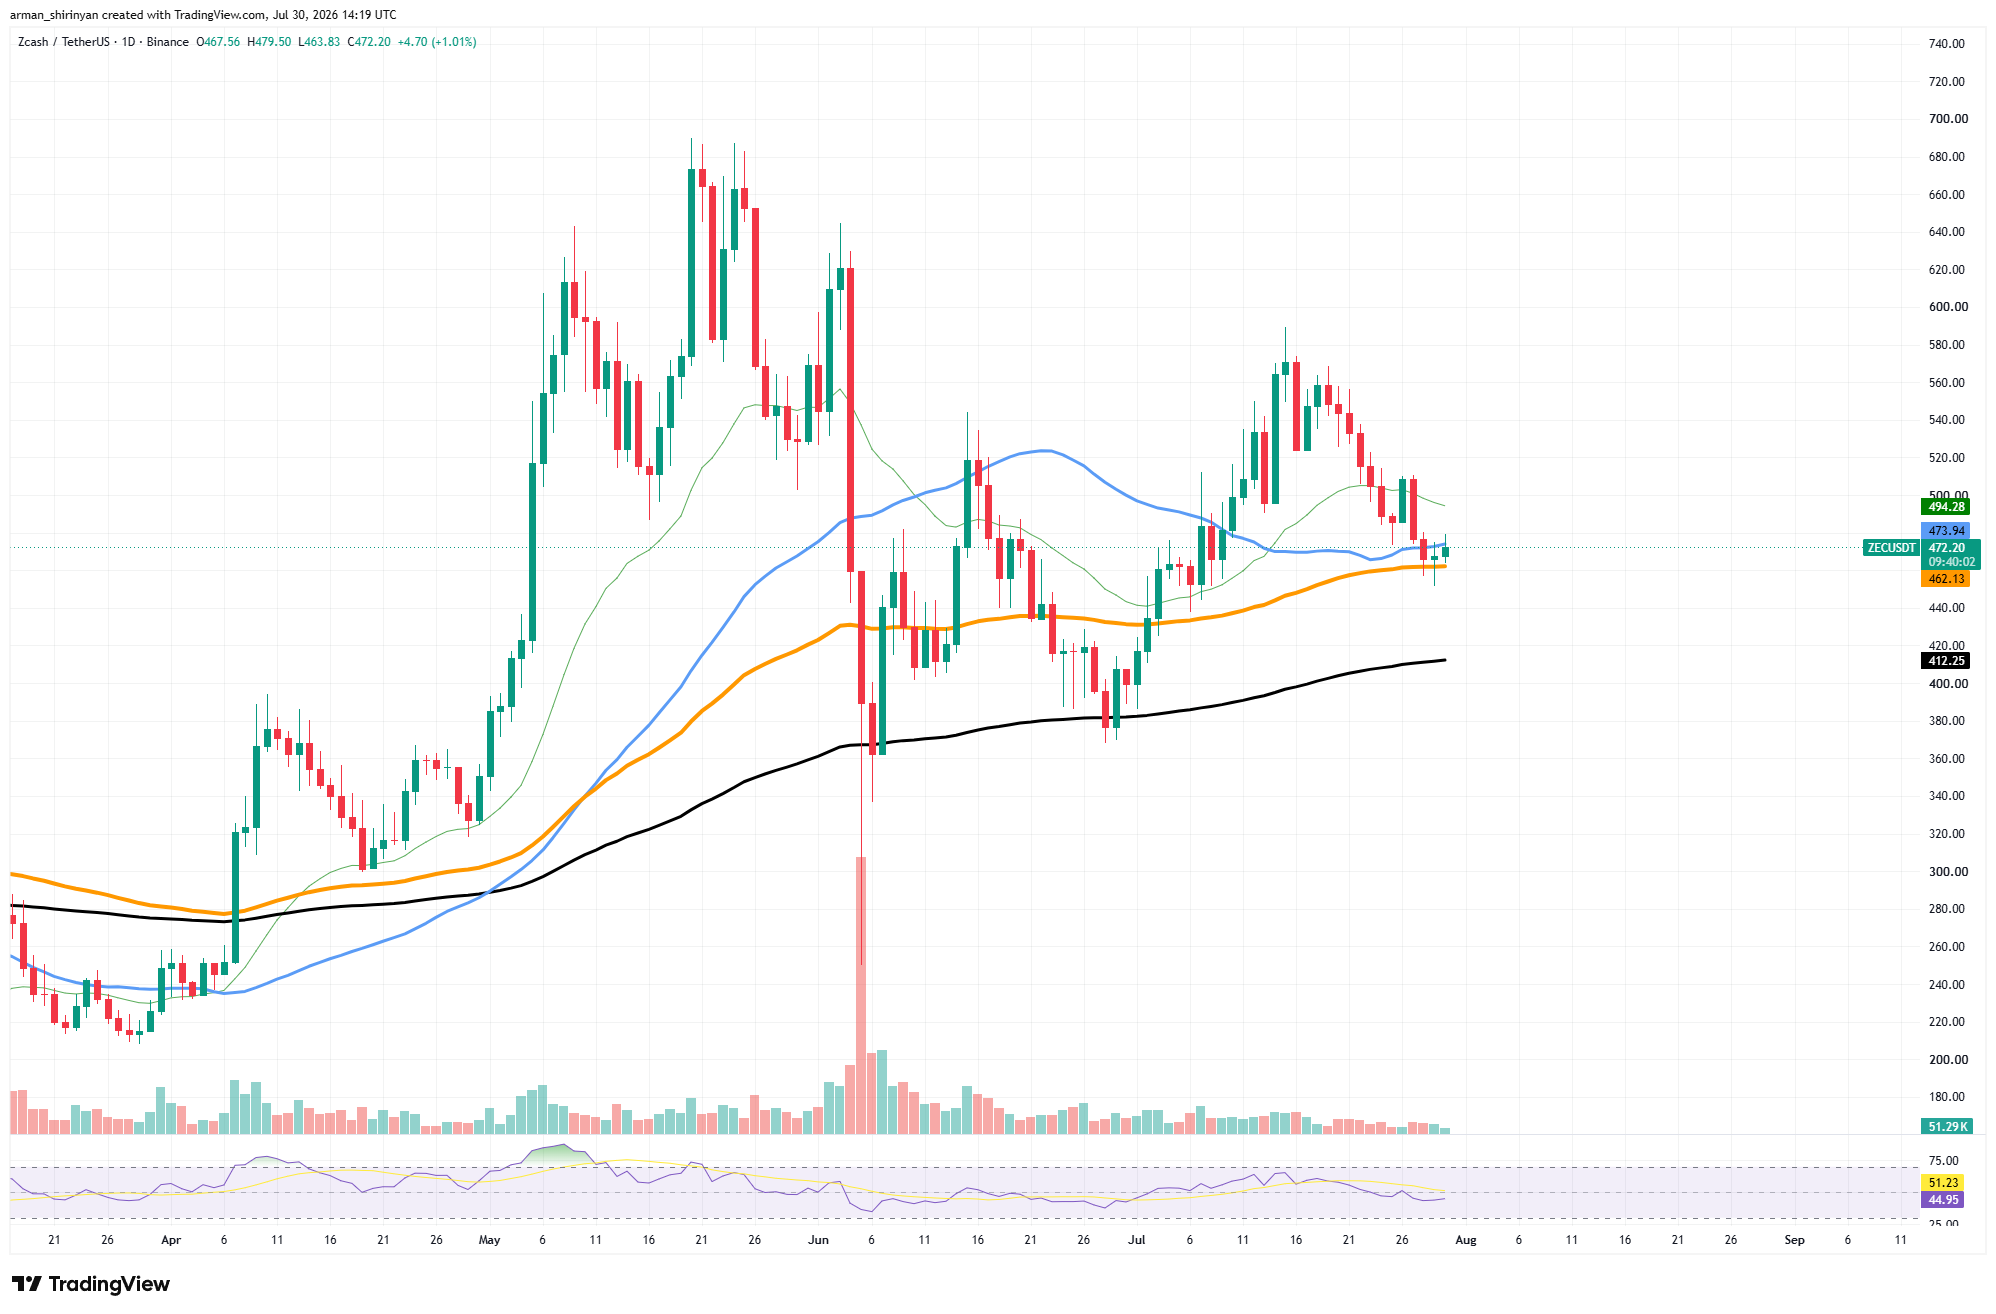
Rather than being violent, the correction itself has been orderly. ZEC formed a series of lower highs as traders locked in profits after the rally toward $570 earlier this month. The decline has, however, slowed significantly near the moving-average cluster, suggesting that buyers are becoming more active around current prices.
The 50-day moving average, which is located close to $495, is the next significant obstacle. The psychologically significant $500 mark would once again be within reach with a decisive close above that level. Beyond that, reclaiming $520 would indicate that the most recent correction has probably ended and return focus to July’s highs.
You Might Also Like

After declining from overbought territory earlier in the month, the Relative Strength Index has marginally recovered to about 46. The RSI has stopped making new lows, indicating that bearish momentum is progressively waning, even though it is still below the neutral 50 level. Volume has also decreased during the correction.
The most recent decline has not been accompanied by significant liquidation, in contrast to the dramatic sell-off that occurred in early June. This suggests that profit-taking rather than panic selling has been the primary driver of this move. Lower selling volume frequently creates favorable conditions for a relief rally if buyers re-enter the market.
ZEC must remain above the 100-day moving average for the bullish case to hold. The recovery outlook would be greatly weakened if that support were lost, exposing the 200-day moving average near $412.
Hyperliquid dropped by institutionals
The month-long correction of Hyperliquid’s native token, HYPE, has continued, raising concerns about whether the asset is merely experiencing a healthy retracement or losing the momentum that made it one of the best performers earlier this year.
The chart indicates that the answer is more nuanced than a straightforward decline in relevance, despite the recent price action being unsatisfactory. After dropping below a number of significant technical support levels, HYPE is currently trading close to $53.2. With the most recent leg lower pushing it below the 50-day and 100-day moving averages, the token has now lost about 25% of its value over the past month.
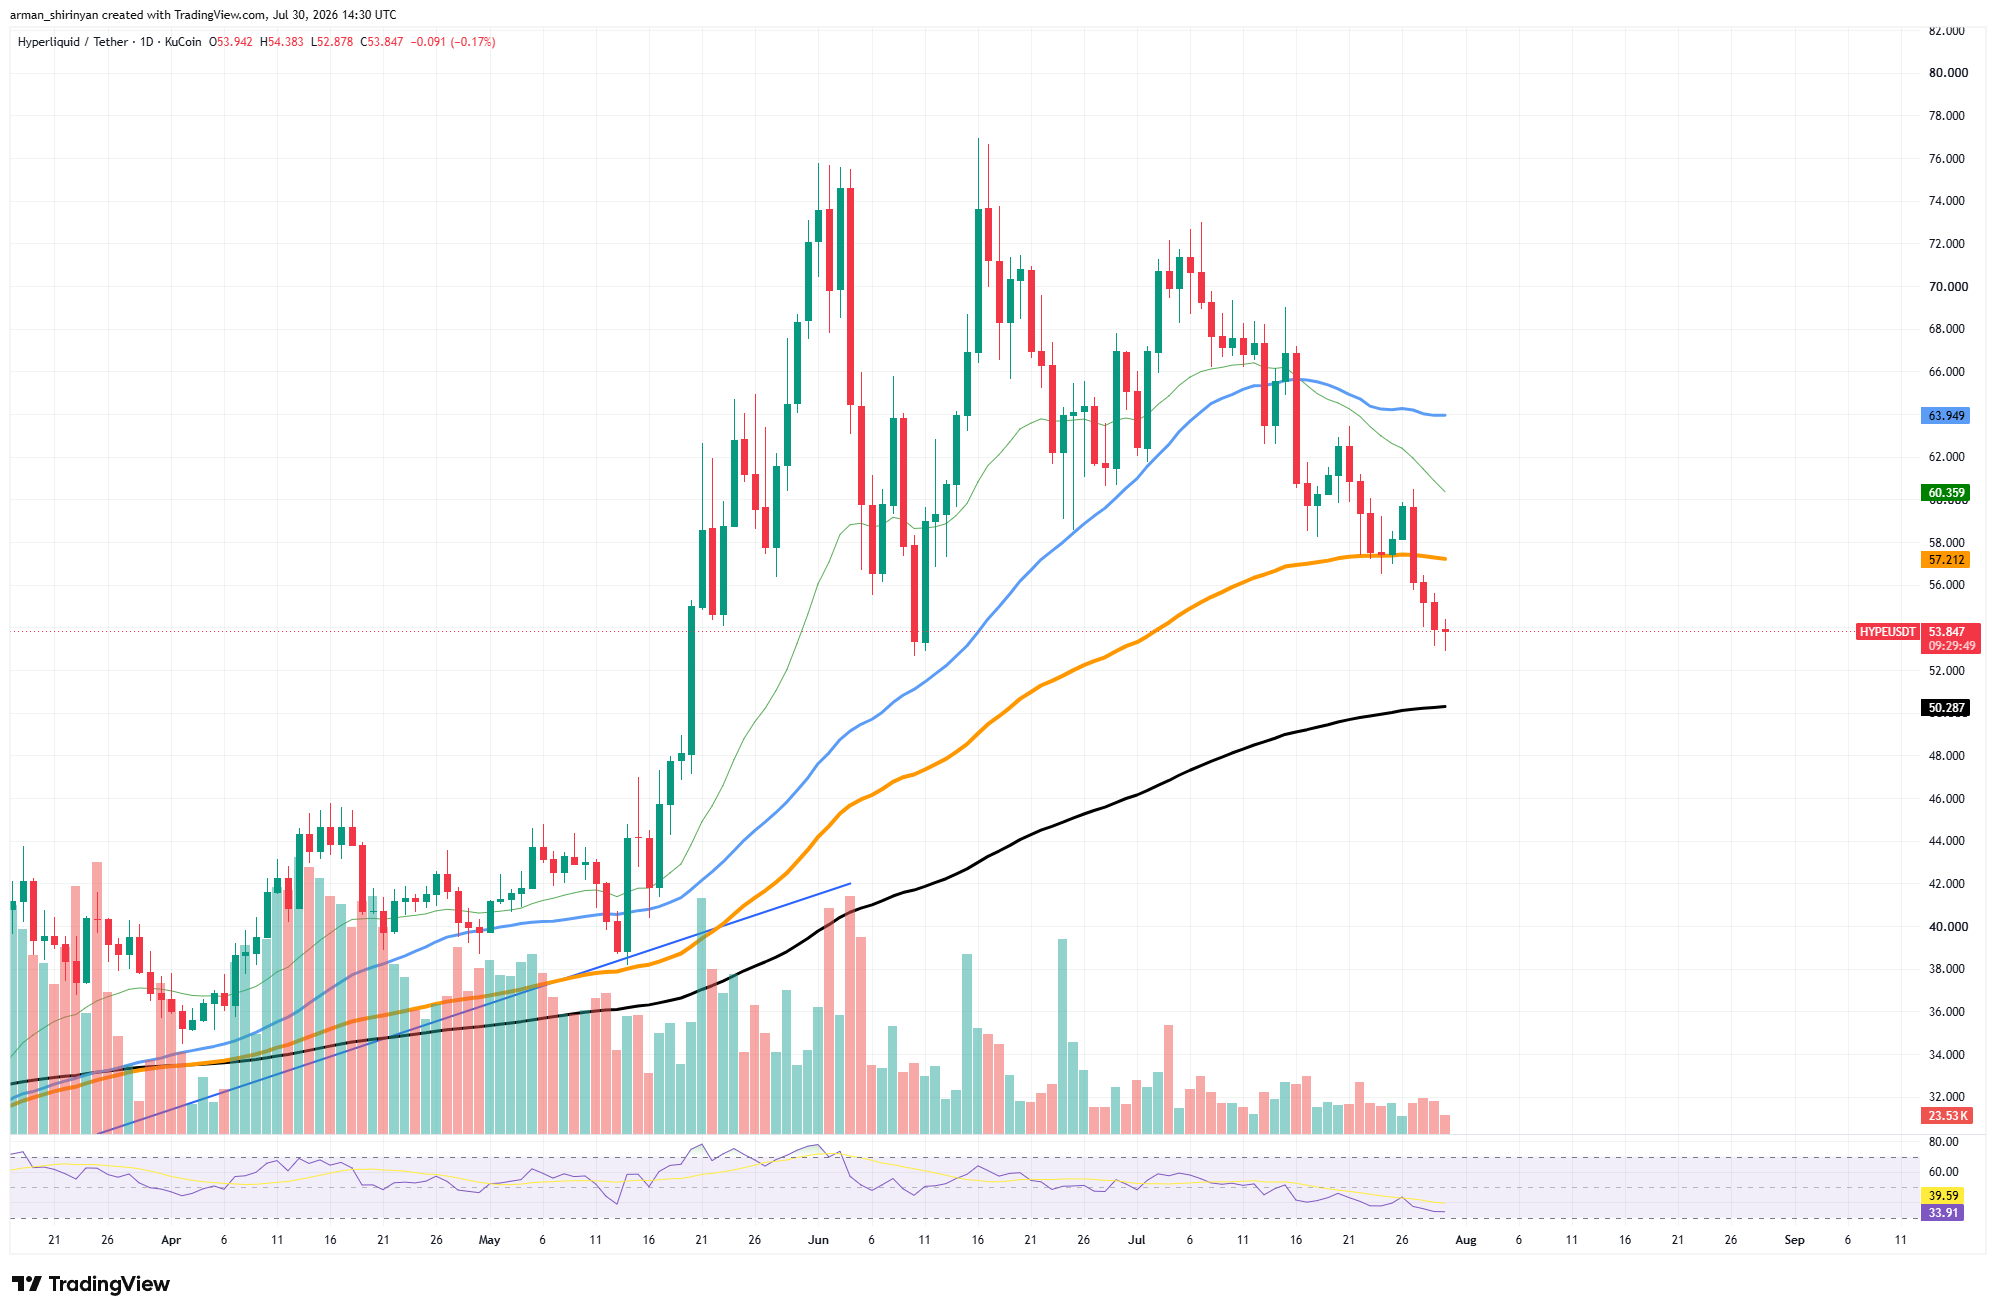
These indicators, which are currently at $57.2 and $60.3, respectively, have flipped from support to resistance, making any short-term recovery more challenging. Additionally, HYPE is currently trading just above its most important long-term support level due to the recent decline.
You Might Also Like

A technical floor that buyers will probably fiercely defend is forming as the 200-day moving average rises toward the $50 mark. The current decline could be viewed as a correction within a larger uptrend rather than the start of a prolonged bear market if that area holds.
However, sellers continue to have significant momentum. Since the Relative Strength Index has dropped to about 33, HYPE is nearly in oversold territory. Oversold conditions alone rarely signal a bottom unless selling pressure begins to ease, even though that frequently raises the likelihood of a relief rally.
In addition, volume has declined significantly compared to May and June’s explosive trading activity. Weaker buying interest is reflected in lower participation as investors hold off on entering the market until they have more solid confirmation.
Additional institutional transfers to exchanges earlier this week from significant holders such as Bitwise and Multicoin Capital raised concerns that large investors may continue reducing their exposure, resulting in a steady supply of overhead selling pressure. Despite the weakness, it would be premature to declare that Hyperliquid is no longer relevant.
Compared to the majority of DeFi assets, the token continues to attract substantial trading activity, and the protocol remains one of the largest decentralized perpetual trading platforms. Profit-taking and deteriorating market sentiment appear to be the main drivers of the correction rather than a collapse in the project’s underlying fundamentals.


Be the first to comment