



Zama [ZAMA] extended its recent rally, gaining 17% over the past day and 117% across seven days.
Fresh capital entered both Spot and perpetual markets, giving the rally support beyond price momentum. However, liquidation clusters below the market could still interrupt the climb.
Why are ZAMA investors accumulating?
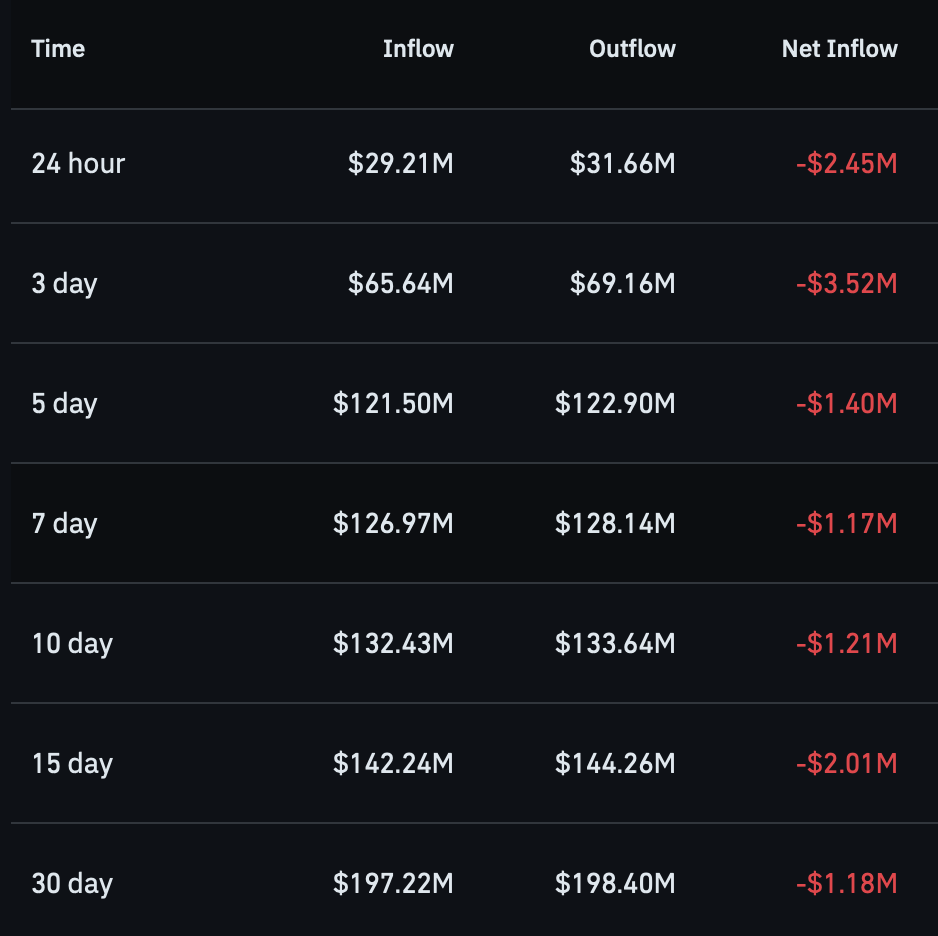
Investors withdrew roughly $31.66 million worth of ZAMA from exchanges over 24 hours.
Meanwhile, Spot Netflow fell to -$2.45 million, confirming that withdrawals exceeded deposits. That shift reduced the amount immediately available for sale, supporting the bullish outlook.

Similar negative Netflows appeared across several timeframes. Therefore, the accumulation was not limited to one interval.
At the same time, capital continued entering the perpetual market. ZAMA’s Open Interest crossed $52 million during the early hours, rising alongside its price.
Together, falling Spot Netflows and growing Open Interest showed participation across both sides of the market.
Could liquidations pull ZAMA lower?
The Liquidation Heatmap complicated that bullish outlook. Several unresolved clusters sat below ZAMA’s price, creating liquidity zones that could attract a pullback.
Near $0.073, the map showed roughly $247,510 in liquidation liquidity. Another $216,090 cluster appeared around $0.071. Further pockets also appeared below those levels, extending the potential downside path.
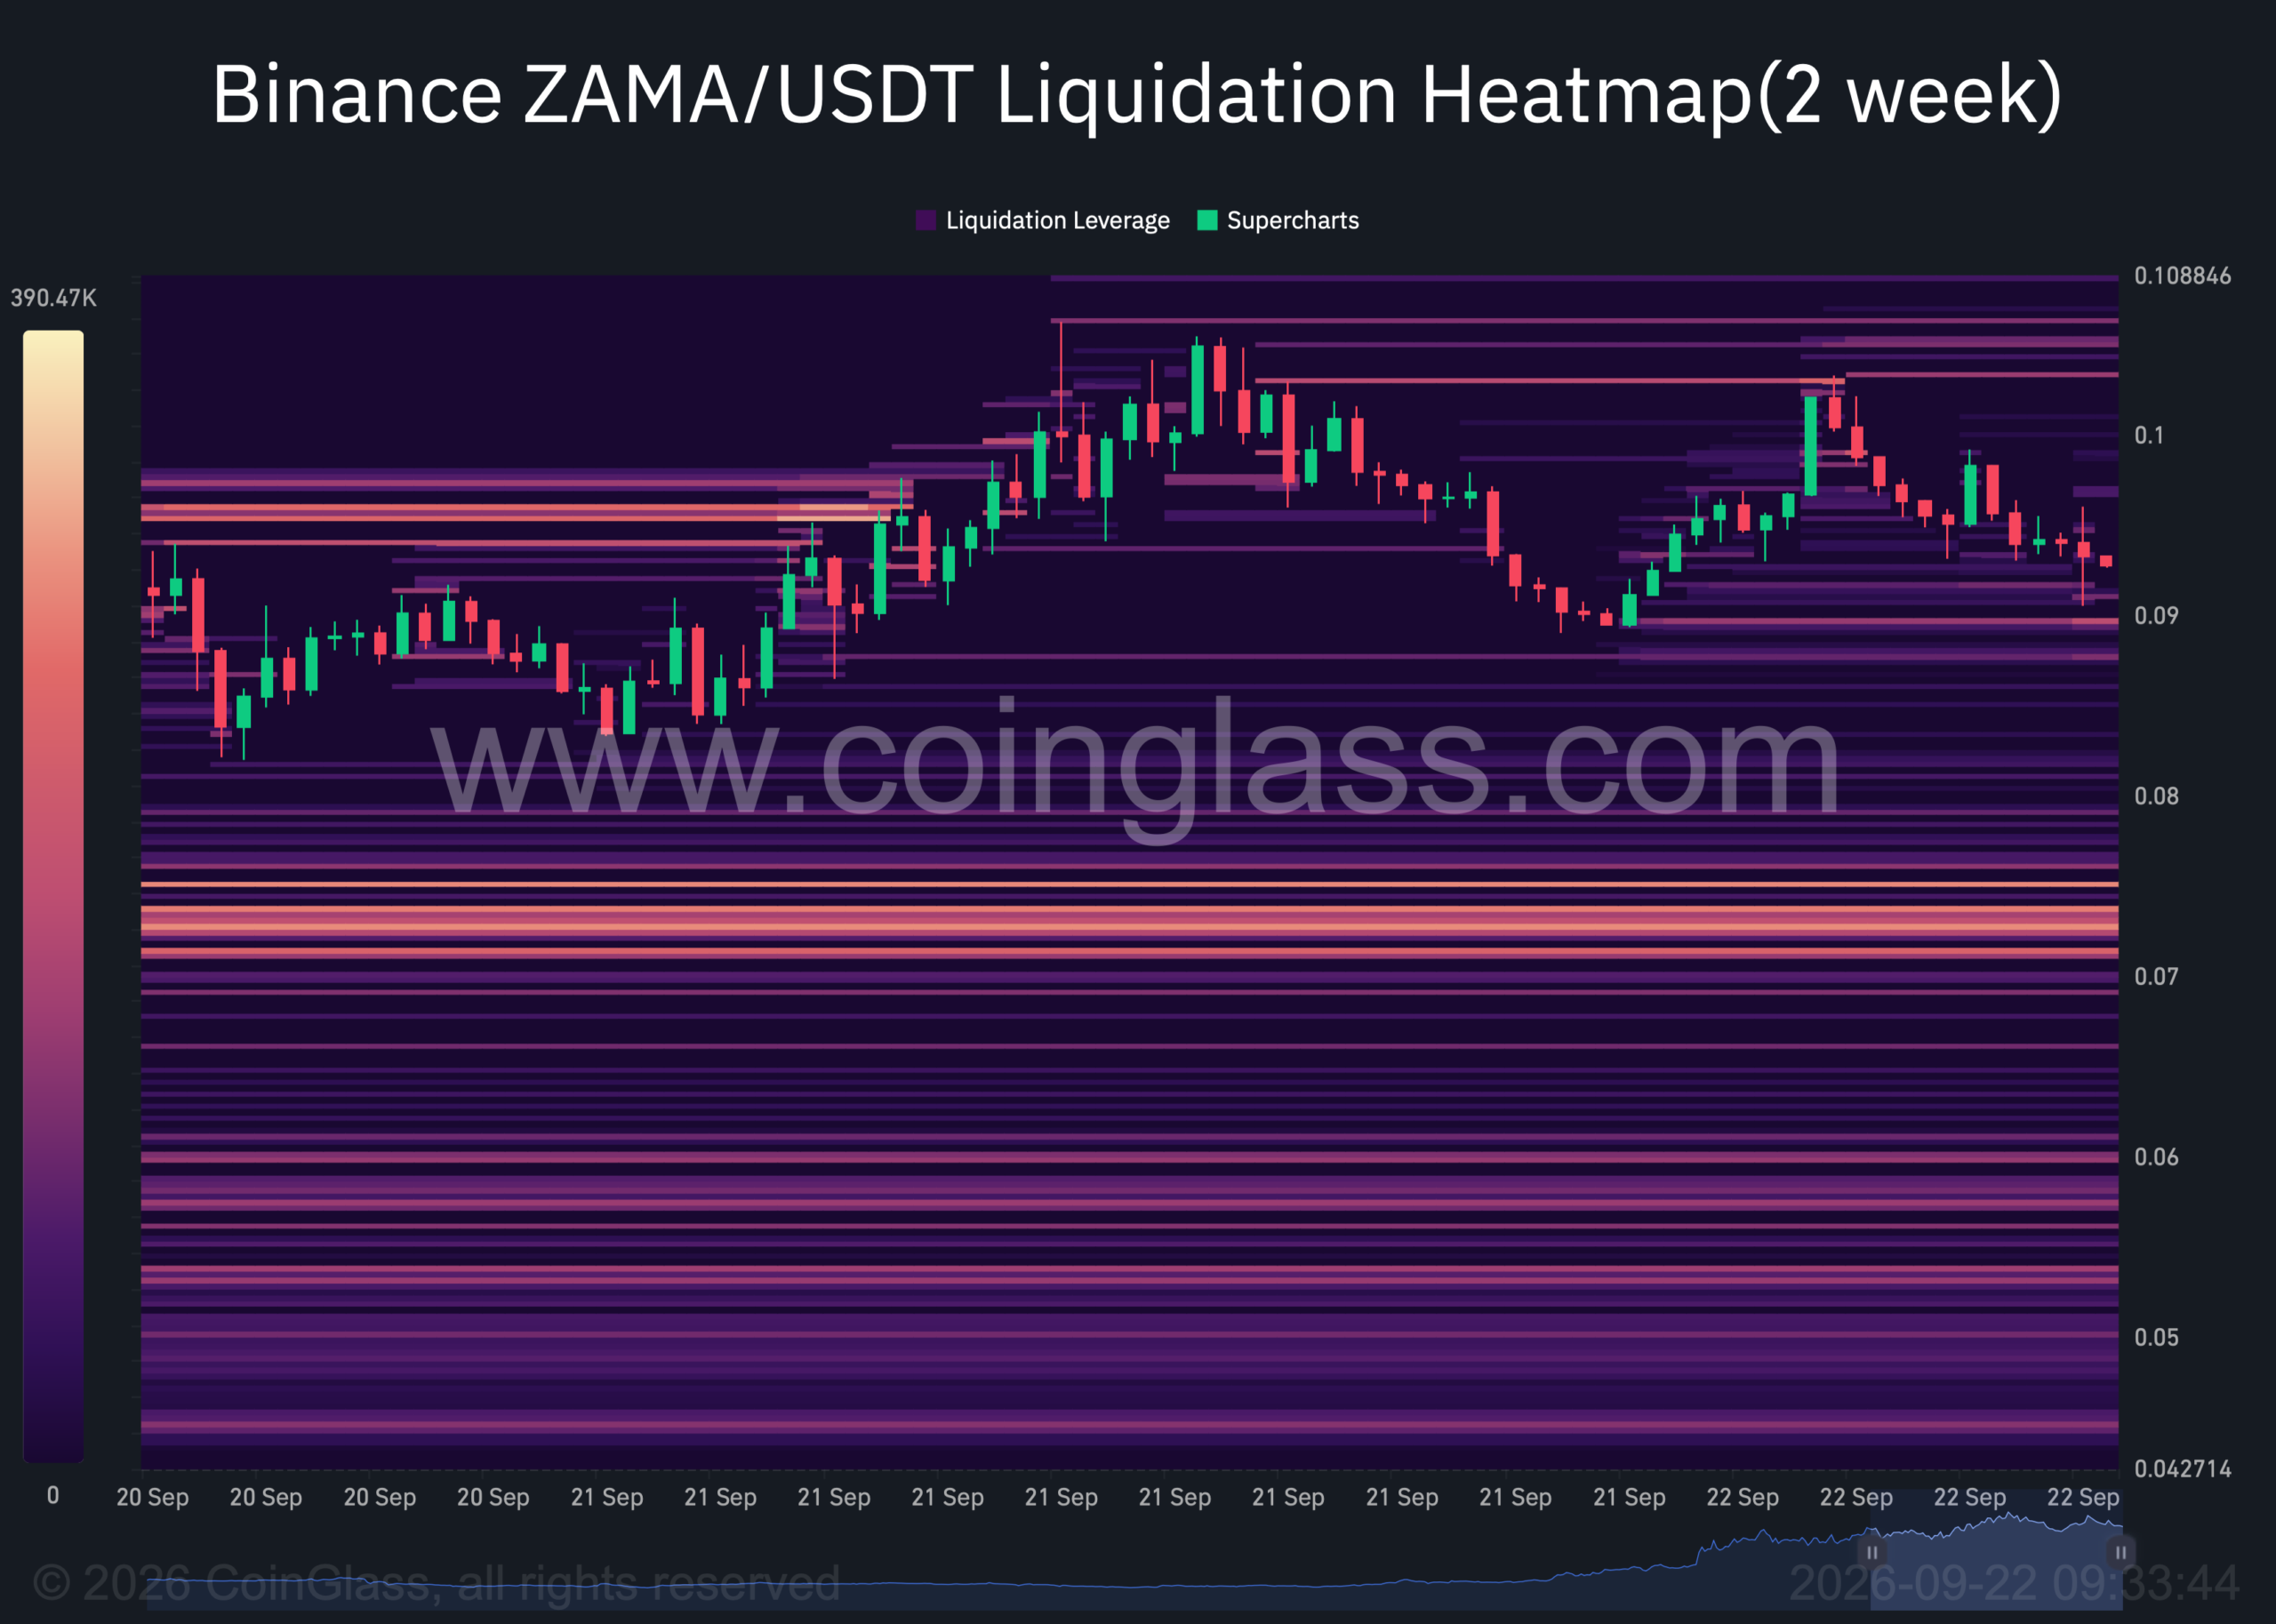
These clusters do not guarantee a decline. However, they could pull price lower before another rally attempt.
Is ZAMA leverage becoming overheated?
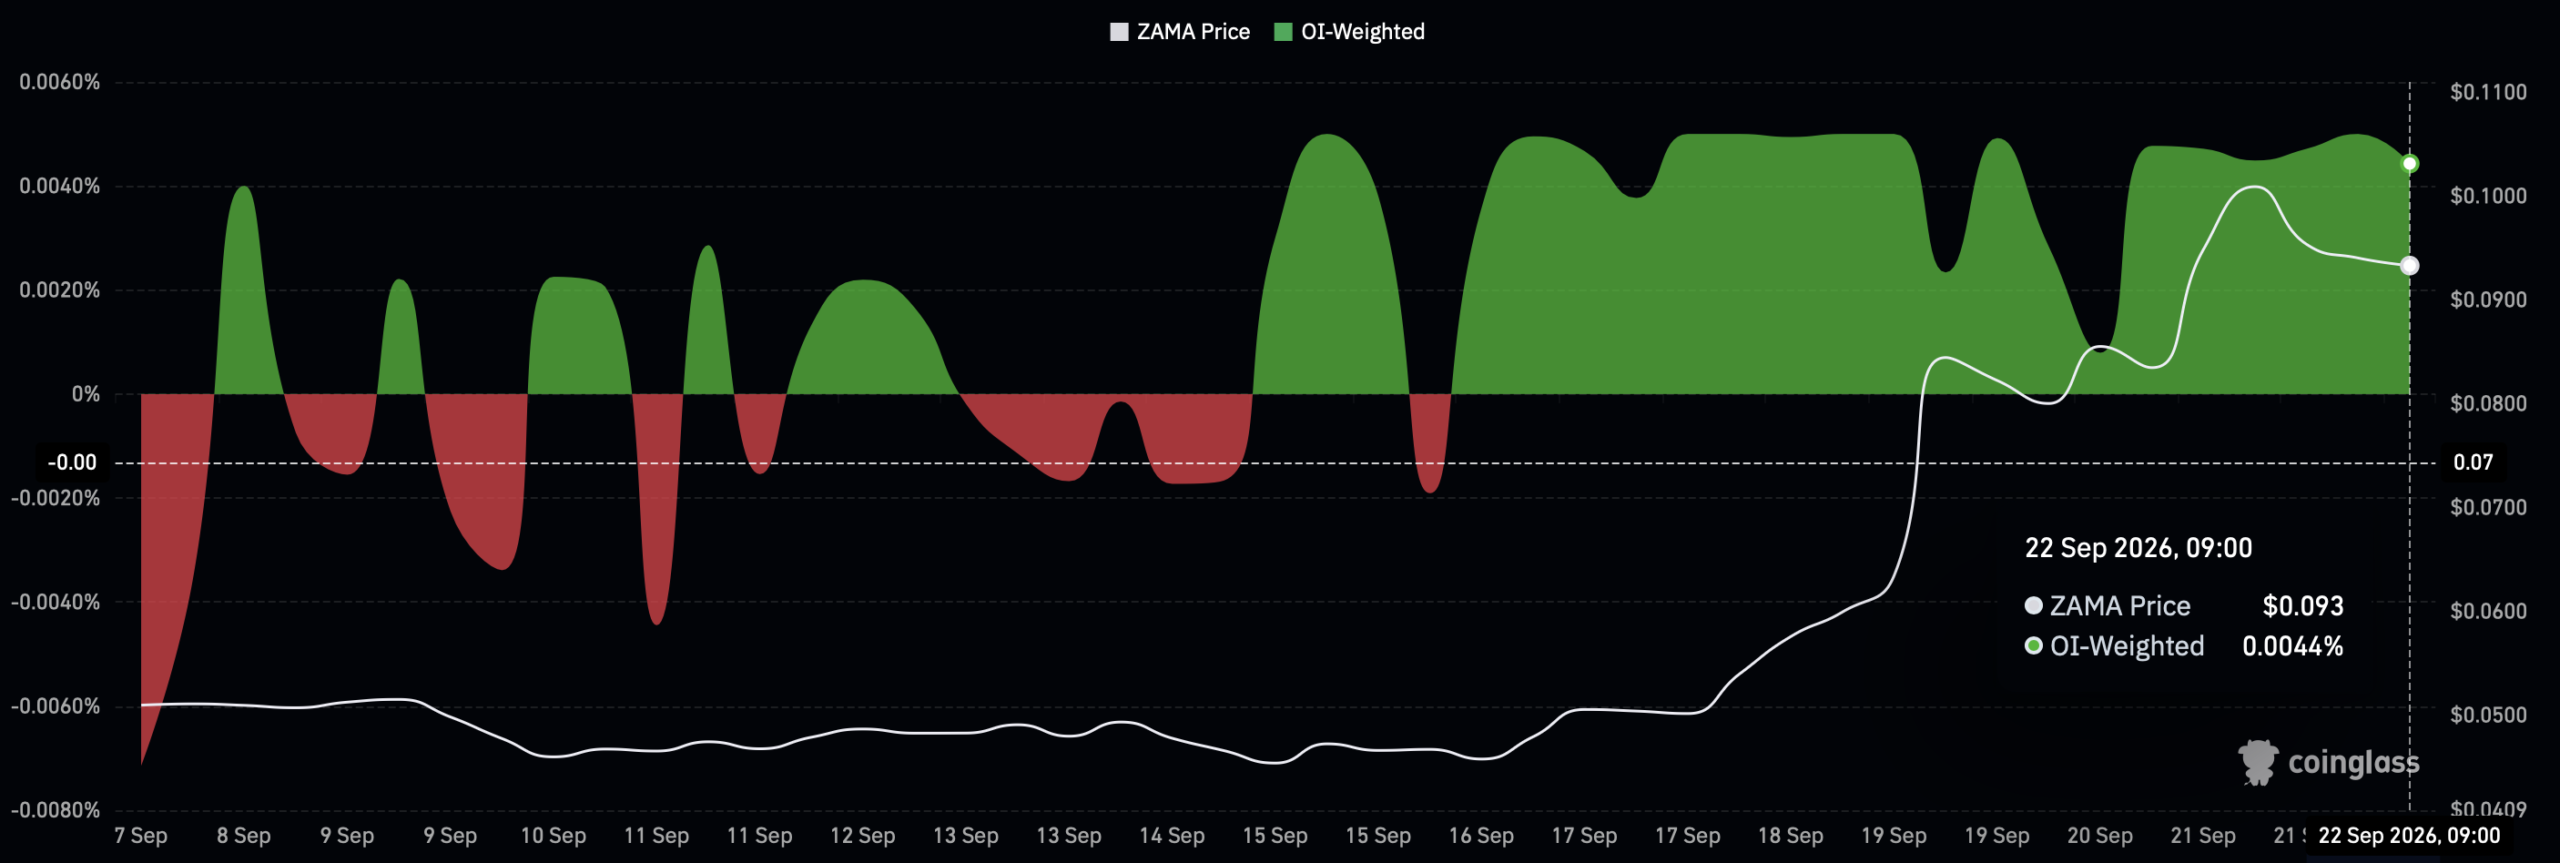
Even so, derivatives positioning had not become excessively aggressive. The Funding Rate held at 0.0044%, meaning longs paid shorts while bullish positioning remained dominant.
Because the reading stayed modest, traders appeared to be adding exposure without creating heavily crowded leverage.
If accumulation and controlled leverage continue, ZAMA could extend its rally despite intermittent pullbacks. Still, its next test may come from liquidity below, rather than resistance above.
Final Summary
- ZAMA gained 17% daily and 117% over seven days.
- Investors withdrew $31.66 million worth of ZAMA from exchanges.




Be the first to comment