


What to know:
- Zcash (ZEC) holds a bullish structure despite a short-term pullback, signaling consolidation before the next move.
- ZEC could target $960–$1,050 if support holds above the 20-day and 50-day EMAs.
- Rising trading volume (up 60%+) shows increased market participation despite volatility.

Zcash (ZEC) remains in a broader bullish trend despite a recent pullback after a strong rally. The ZEC price may consolidate before its next move, and if support holds, the uptrend could resume with potential upside toward higher resistance levels around previous projected targets.
At the time of writing, ZEC is trading at $529.41 with a 24-hour trading volume of $877.84 million and a market capitalization of $8.84 billion. Despite the 3.76% loss over the last 24 hours, the ZEC price structure and rising volume point to a bullish reversal.


Source: CoinMarketCap

ZEC Price Setup Points to a Bullish Rally Toward $1,050
Furthermore, the crypto analyst Chiefrat highlighted that ZEC has drawn renewed attention after revisiting the $680 zone, reinforcing its broader bullish structure.
Previously highlighted near the $200 range as a potential trend driver, the ZEC price has now transitioned into a phase where former resistance levels are being tested as support, signaling continued market strength within its ongoing uptrend.

Source: Chiefrat’s X Post
Analysts now expect a brief consolidation phase for the ZEC price as momentum cools and the market stabilizes above recent gains. If support holds, the next projected upside region lies between $960 and $1050.
This scenario depends on sustained buying pressure and structural confirmation, but overall sentiment suggests continuation of the broader trend rather than reversal at current levels.
Also Read: ZEC Price Analysis: Bullish Breakout Points to a Rally to $700 Resistance
ZEC Technical Outlook Points to Short-Term Pressure
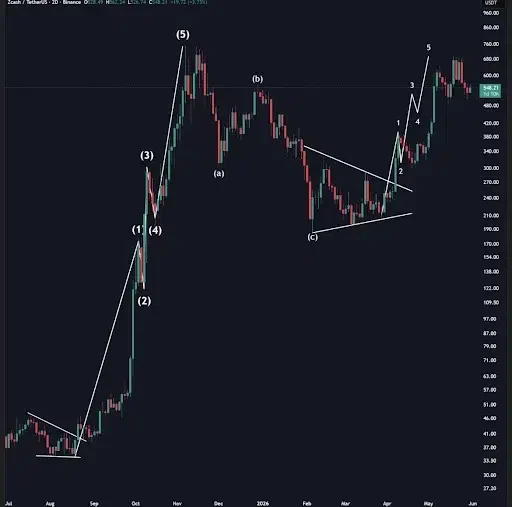
According to TradingView, the ZEC price has enjoyed a strong uptrend in its macro picture, recently transitioning to a corrective period.
The ZEC price ranged from around $200 to $300 for April before surging to $700.00. However, the latest candle shows an impressive 6.69% drop down to $530.24, closing lower than its open price during the period.


Source: TradingView
From a technical perspective, this current slide seems to be targeting and penetrating some key levels of dynamic support. The ZEC price has broken below the 20-day EMA at 556.72 and the Bollinger Middle Band.
In the event that the downtrend continues, then buyers should look to find a good level of support at the 50-day EMA or Bollinger Lower Band.
Rising Volume Reveals Upward Potential
However, the trading volume of ZEC increased by 60.19% to $3.54B, indicating greater levels of trading activities and involvement. The increase signifies higher involvement from traders, given that there have been many more trades compared to previous intervals.


Source: Coinglass
The open interest fell by 5.77%, totaling $1.12 billion. This indicates that there are fewer contracts held on the exchange. This indicates that there is a profit-taking strategy going on. This suggests a sense of caution among traders.
This article contains market analysis and price predictions. These are not guarantees. Crypto markets are volatile. Always DYOR. Not financial advice.
Also Read: ZEC Price Analysis: $500 Support Level Becomes Make-or-Break Zone for Bulls

Be the first to comment