



Cardano jumped toward $0.235 on a scaling milestone, then slid back near $0.22, and liquidation data shows leveraged longs took the hit.
A trader watching the CoinGlass terminal at four in the morning UTC would have seen something odd. Cardano’s ADA token had just wiped out more long positions in twelve hours than in the previous four days combined, and the coin was still up on the week.
That contradiction is the whole story right now. ADA sat near $0.2199 at writing time, down something like 3.5% on the day, and that came less than 48 hours after it tagged $0.2350 on a Cardano scaling headline. Looked at on a daily chart, honestly, the pullback barely registers as news. The order flow underneath it tells a different story though.
What Actually Pushed ADA To $0.235
Start with what actually changed. The Cardano Foundation confirmed on X that the Leios public testnet, built with Input Output Group and Intersect, is now live and stake pool operators can go test it themselves. Simulation work behind it points toward somewhere in the 100 to 1,000 transactions per second range once the design eventually ships to mainnet, a jump from roughly 4.5 kilobytes per second today, at least on paper. That landed only days after a September 15 announcement that the Foundation had joined a Mastercard program looking at cross border settlement, not to mention a September 7 mainnet deployment of node 11.1.1.

Three separate pieces of good news inside two weeks is unusual for this chain. Price reacted the way crowded, thin order books usually react to a genuine catalyst. It overshot.
Weekly Chart Still Reads Bearish, Not Reversed
Zoom out to the weekly timeframe and the bounce barely registers. ADA topped near $1.32 in 2025 and has carved a clean sequence of lower highs since, the kind of structure ICT traders call a bearish market structure that stays intact until a prior lower high actually gets reclaimed with a close, not a wick. Price is still compressed against the liquidity resting under the multi-month low near $0.145, the sell-side pool that keeps getting tested but not fully swept.
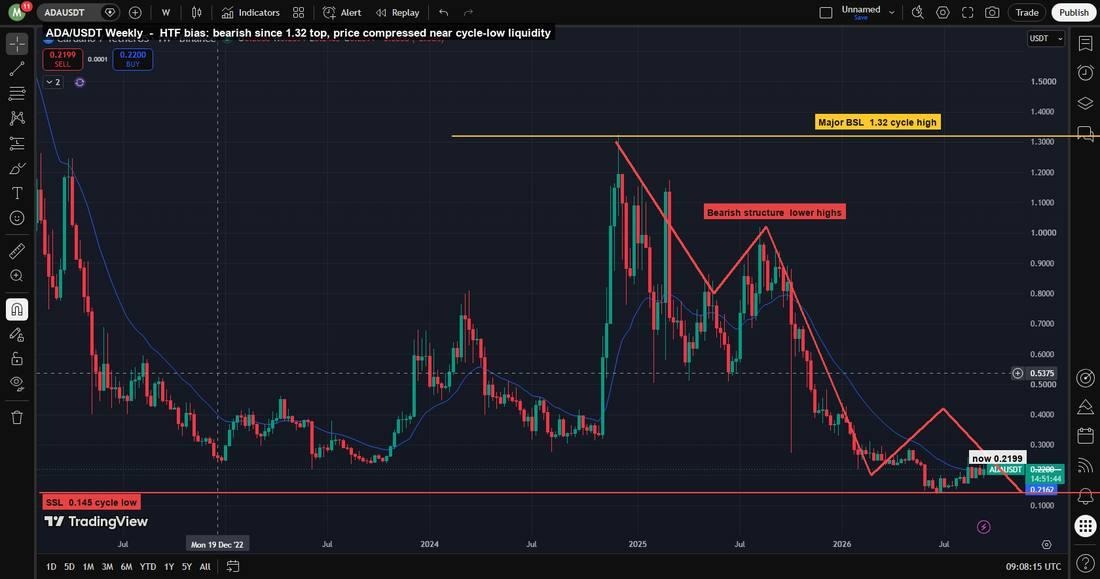
ADA/USDT weekly chart on TradingView, bearish structure since the 1.32 cycle top with the 0.145 sell side liquidity pool marked.
Daily Range Gives The Bulls A Little More Room
Drop to the daily chart, and honestly the picture gets a little less scary. Early September is when ADA actually broke that short-term structure, climbing out of a demand block sitting around $0.16 to $0.18 and stacking higher lows all the way into the $0.235 spike. Zoom out on the range itself and it still runs from that $0.145 low up toward a resistance shelf near $0.305, the same shelf that turned price away twice already this year. Somewhere in the middle of that box is where ADA sits right now, not really close to either edge.
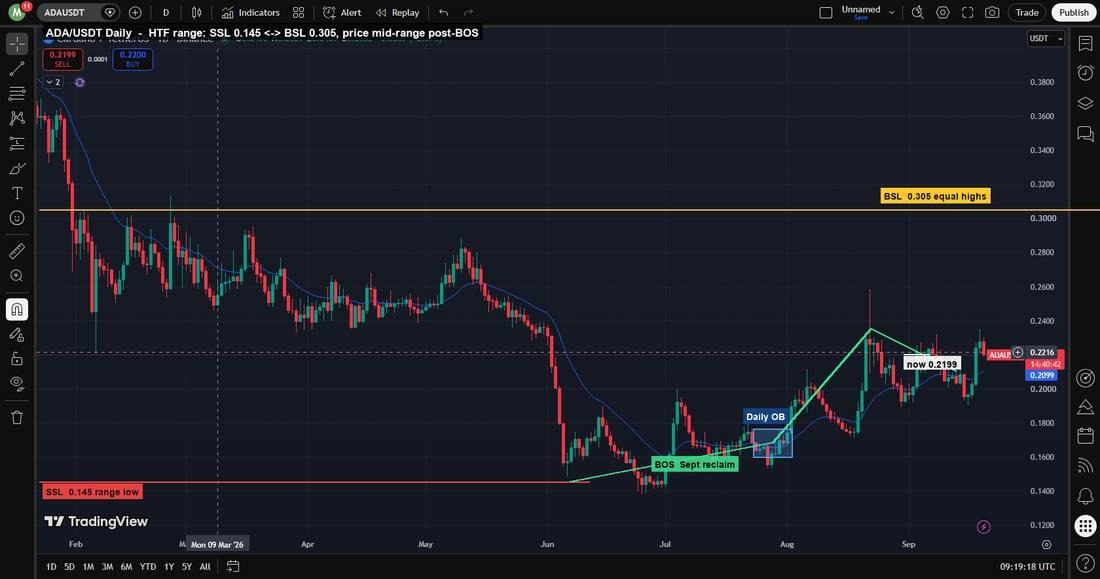
ADA/USDT daily chart on TradingView, September break of structure into a range bounded by 0.145 and 0.305.
The One Hour Chart Shows The Actual Trap
This is where the ICT setup gets specific. ADA swept the equal lows sitting near $0.1887 on September 17, tagged a bullish order block just above that wick, then broke structure hard on the way to $0.2350, a level that had been sitting as untouched buy-side liquidity since the prior swing. Price is now retracing into a return to the order block zone between roughly $0.2150 and $0.2220. Holding that pocket keeps the bullish leg alive, with $0.2350 as the magnet again. Losing it below $0.2130 opens the door back toward the order block base near $0.195.
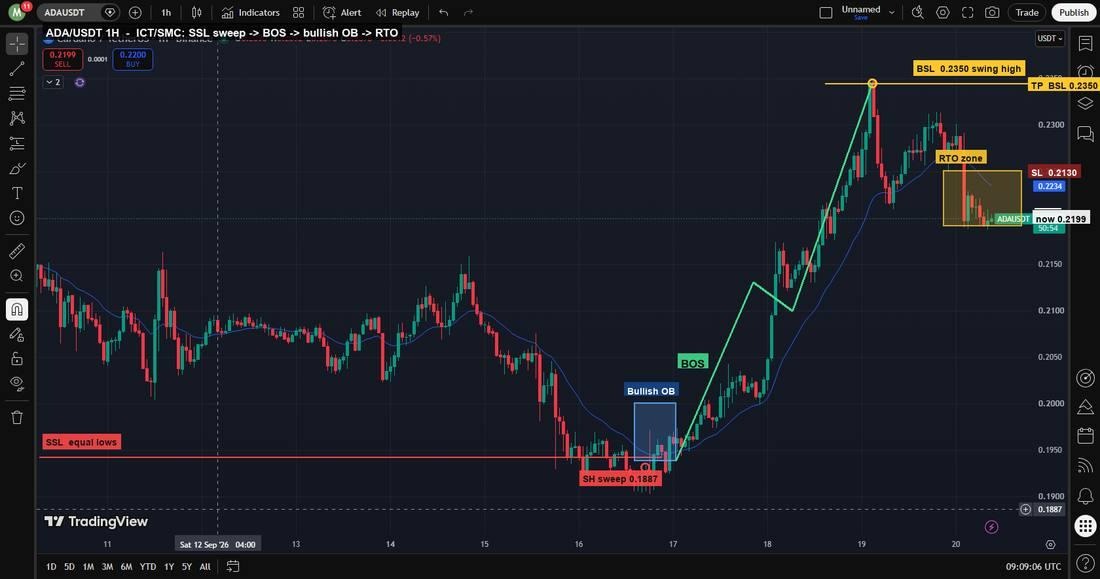
ADA/USDT one hour chart on TradingView, sell side sweep, break of structure, and the current return to order block zone.
Liquidation Data Names The Crowd That Got Hurt
Positioning data from CoinGlass tells the rest of it. Open interest on ADA sits near $506.5 million, and the Binance long to short account ratio reads 2.01, meaning retail traders were running roughly two long positions for every short into the top. That is a crowded, one sided book.
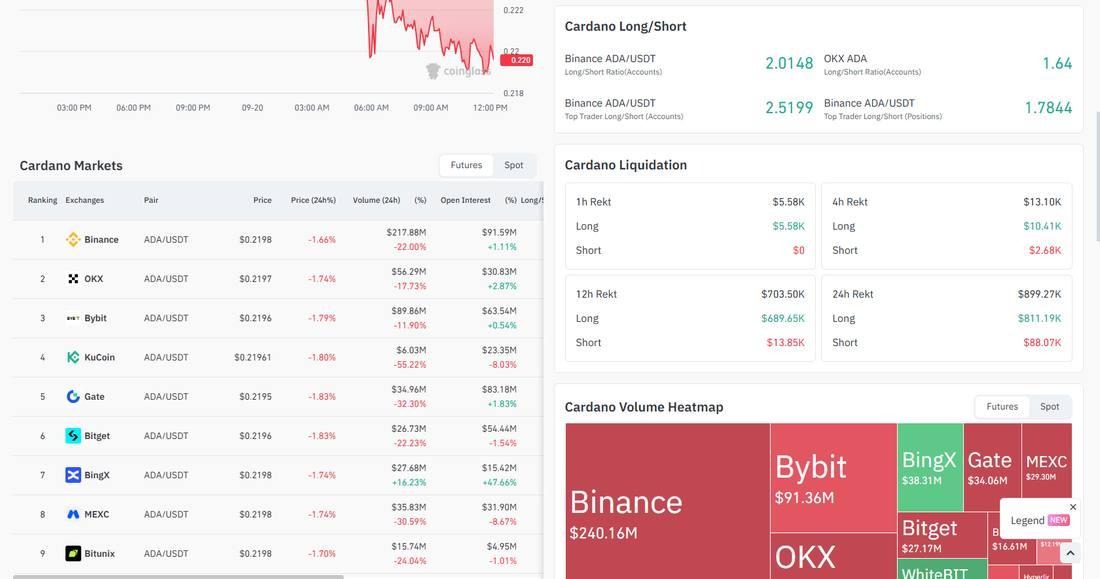
ADA long/short ratios and liquidation totals from CoinGlass, showing a heavy long skew ahead of the pullback.
The rekt numbers confirm who paid for the overshoot. Over the past 24 hours, ADA futures liquidated roughly $899,000, split between $811,000 in long positions and just $88,000 in shorts, a nine to one imbalance. In the 12 hours around the drop from $0.235, longs alone absorbed $689,650 of that damage. That is a liquidity heatmap in numbers rather than a color gradient, and it points the same direction the chart does. Leveraged longs opened into the spike, got trapped when momentum stalled at buy side liquidity, and were flushed out on the retrace.
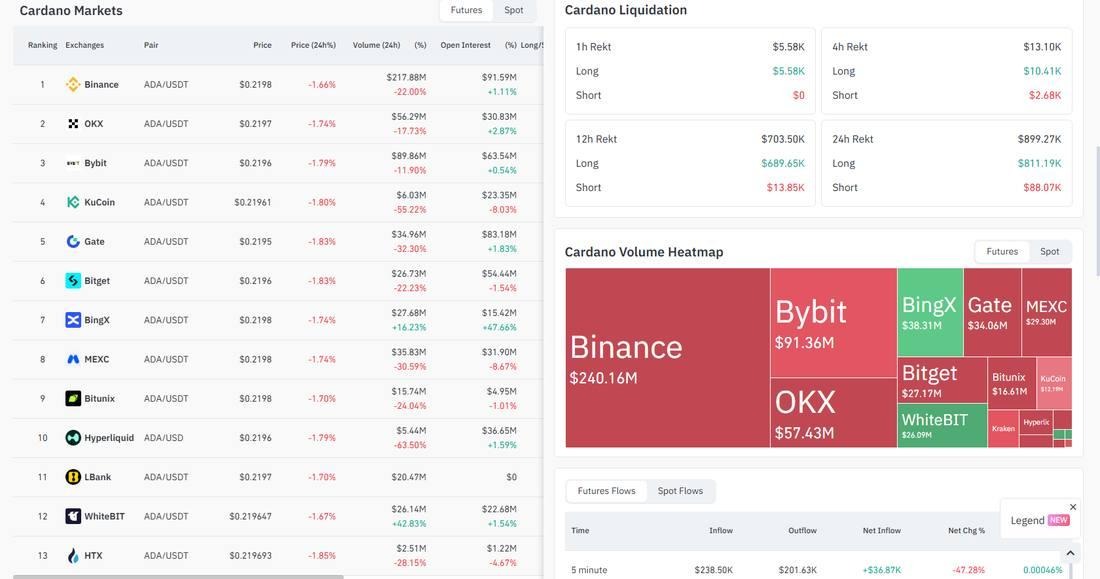
ADA liquidation totals by window from CoinGlass, long side losses outweighed shorts by roughly nine to one over 24 hours.
What This Means Alongside The Broader Market
None of this happened in isolation. Bitcoin slipped toward the low $80,000s the same session even as exchange reserves climbed, a setup covered in a fresh look at Binance’s Bitcoin reserves, while a broader piece on how altcoins are reclaiming their 200-day averages puts ADA’s move in a wider context of leveraged risk coming off across the board, not a Cardano-specific problem.
ADA’s next move likely hinges on whether the $0.2150 to $0.2220 pocket holds through the next few sessions. A reclaim of $0.2350 with fresh spot demand, not just short covering, would put the daily range’s $0.305 shelf back in play. A clean loss of $0.2130 would hand control back to sellers and put the order block base near $0.195 back on the table.
This article covers price action and technical analysis for informational purposes only and is not financial or investment advice.



Be the first to comment