


What to know:
- Chainlink’s MVRV golden cross signals a potential long-term bullish trend reversal.
- Chainlink active addresses nearly doubled, pointing to growing network participation.
- LINK faces key resistance at $8.80, with a breakout potentially targeting $11.
Chainlink is showing growing signs of a bullish reversal as whale activity, network participation, and market valuation trends improve. Technical indicators are also turning positive, with LINK testing a key resistance zone that could determine whether the cryptocurrency enters a stronger recovery phase.
Chainlink Gains Momentum as MVRV Golden Cross Emerges
According to the crypto analyst Ali Charts, Chainlink (LINK) is showing signs of a potential macro trend reversal as several on-chain and technical indicators begin aligning in favor of buyers.
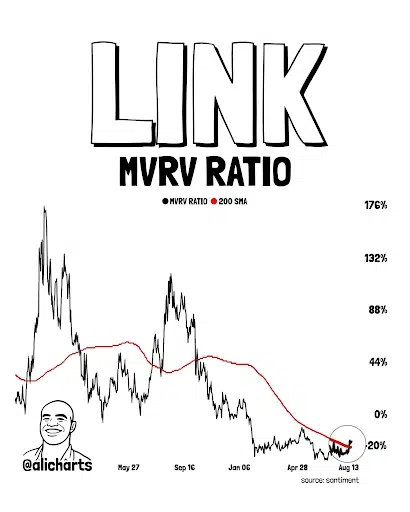
For the first time in more than a year, LINK’s MVRV ratio has formed a golden cross against its 200-day simple moving average (SMA), a development that has historically preceded significant upside moves.

Source: Ali Charts’s X Post
The MVRV ratio compares Chainlink’s market value with the realized value of tokens held by investors, helping identify periods when the asset may be relatively overvalued or undervalued. A bullish crossover above the long-term 200 SMA can indicate improving market conditions and renewed accumulation.
Previous signals were followed by a 155% rally in November 2024 and an 85% advance in July 2025. While historical performance does not guarantee another rally, the latest crossover could strengthen the bullish outlook if other indicators continue to confirm the trend.
Also Read: Chainlink Price Prediction: LINK Eyes $9 Breakout as Buybacks Top $42.9M
Whale Activity and Network Growth Strengthen Bullish Case
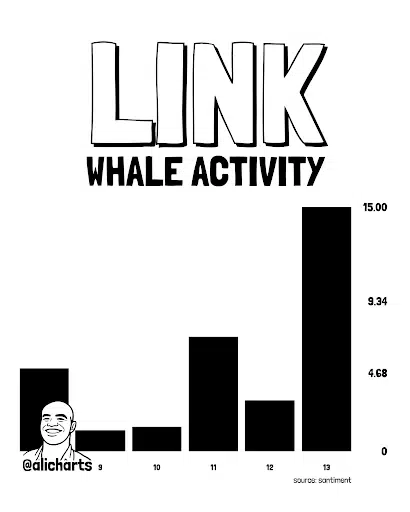
Activities of large holders are also contributing towards the development of the system. Over the last 96 hours, there has been an increased number of transactions over $1 million on the Chainlink platform from approximately one transaction to about 15 transactions. This is indicative of increased activities of whales in the system.
Source: Ali Charts’ X Post
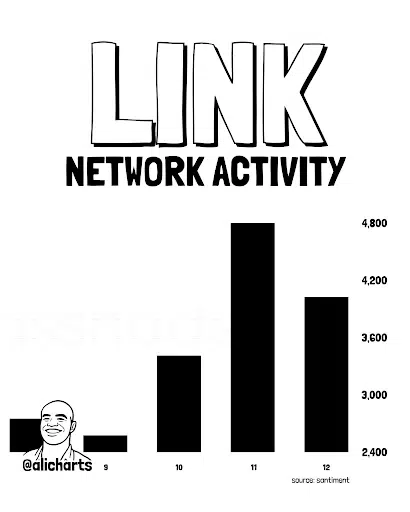
On the other hand, the network activity of Chainlink has been positively impacted as well. While active addresses have increased almost two times and amounted to 4,800 compared to 2,450, over the given period.
However, the increasing number of whales’ transactions and active addresses does not mean for sure whether whales are hoarding or releasing LINKs on the market.
Source: Ali Charts’ X Post
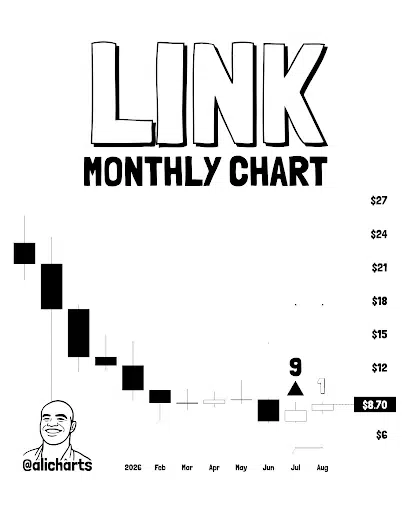
However, the technical outlook is also turning constructive. TD Sequential has given out a buy signal on the monthly chart of LINK, suggesting that the long-term bear trend might be losing its steam.
Monthly signals are always more significant than other signals due to their nature; therefore, confirmation by price action could become highly important for Chainlink.
Source: Ali Charts’ X Post
LINK Price Tests $8.80 Resistance With $11 in Focus
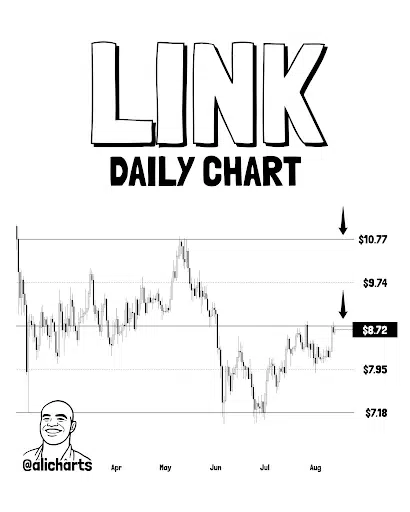
LINK on the D1 chart is now challenging the center of a parallel channel formed near $8.80. This is a key resistance zone for the short-term, and if LINK manages to close above it, it will be considered a positive sign for the bulls.
Source: Ali Charts’ X Post
In case LINK manages to break out of the midpoint of the channel to the upside and sustain the breakout, the next possible target area may develop around the upper border line at $11.
Considering the $8.80 price level as a starting point, this will mean an upward move of about 25%, with 30% growth being more probable.
Until then, traders would want to see whether LINK is able to take back the $8.80 mark with growing network activity and whale involvement.
Any breakout with positive on-chain data would bolster the case that Chainlink has moved from a prolonged bear trend into a fresh bull trend.
Also Read: Chainlink Gets $200 Target as Tokenized Assets Reach $4T
This article contains market analysis and price predictions. These are not guarantees. Crypto markets are volatile. Always DYOR. Not financial advice.



Be the first to comment