



Chainlink’s [LINK] recovery faced a fresh test after a whale moved $2.3 million in LINK to Coinbase as the price retreated from its recent peak.
The whale transferred 198,300 LINK, worth roughly $2.3 million, to Coinbase after previously acquiring the tokens from Cumberland. The exchange deposit brought in sell-side supply as Chainlink pulled back from its recent gains.
However, the transaction followed a strong weekly advance, with LINK previously gaining 22.82% over seven days. Price quickly reversed, falling 3.04% in the 24 hours, at press time, as profit-taking pressure set in around the recent highs.
The whale’s Coinbase transfer, therefore, added another supply risk during an increasingly vulnerable phase. However, a single large deposit did not provide for wider exchange-wide distribution.

Spot outflows challenge whale-led selling pressure
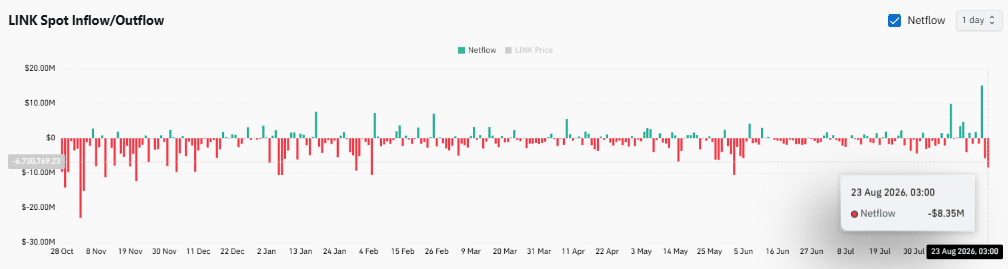
Despite the whale’s deposit on Coinbase, LINK had $8.35 million in spot net outflows as of writing. These outflows indicated the aggregate exchange withdrawals exceeded the incoming LINK supply during the measured period.
Therefore, the broader flow picture remained more supportive than the whale transaction initially implied. The $8.35 million outflow was also significantly higher than the whale’s $2.3 million deposit.
If the trend persists, it could reduce the immediately available exchange supply. But the latest reading came after a number of big inflow peaks in August, which produced a mixed short term supply picture.
Consequently, the whale deposit caused a concentrated selling pressure but did not change the daily selling flow pattern otherwise.
Leverage retreats as traders reduce exposure
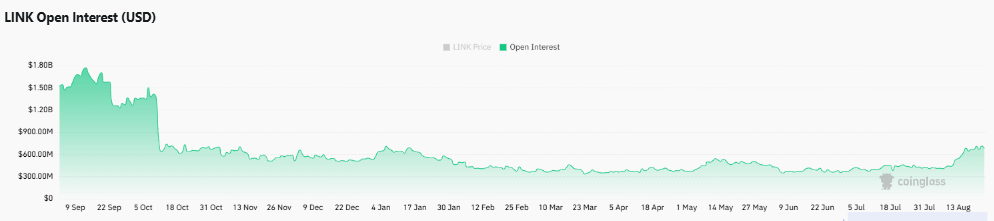
At press time, the Open Interest (OI) had fallen 6.35% to $670.45 million while LINK moved lower from its recent rally.
The contraction in this case meant that traders were unwinding leveraged exposure, not aggressively building up positions during the pullback.
If LINK experiences more selling pressure near the breakout area, this deleveraging may cap some speculative buying pressure. But lower leverage might also mean less volatility following the surge in price.
More importantly, the decline arrived while LINK still retained substantial weekly gains. Thus, derivatives participation slowed down before the price had fully lost its recent recovery trend.
Spot outflows offered some balance against the weaker derivatives picture, leaving neither side fully dominant. Therefore, price behavior around the $10.693 level would now be the best indicator of whether the underlying demand is still solid.
Can $10.693 keep LINK’s breakout intact?
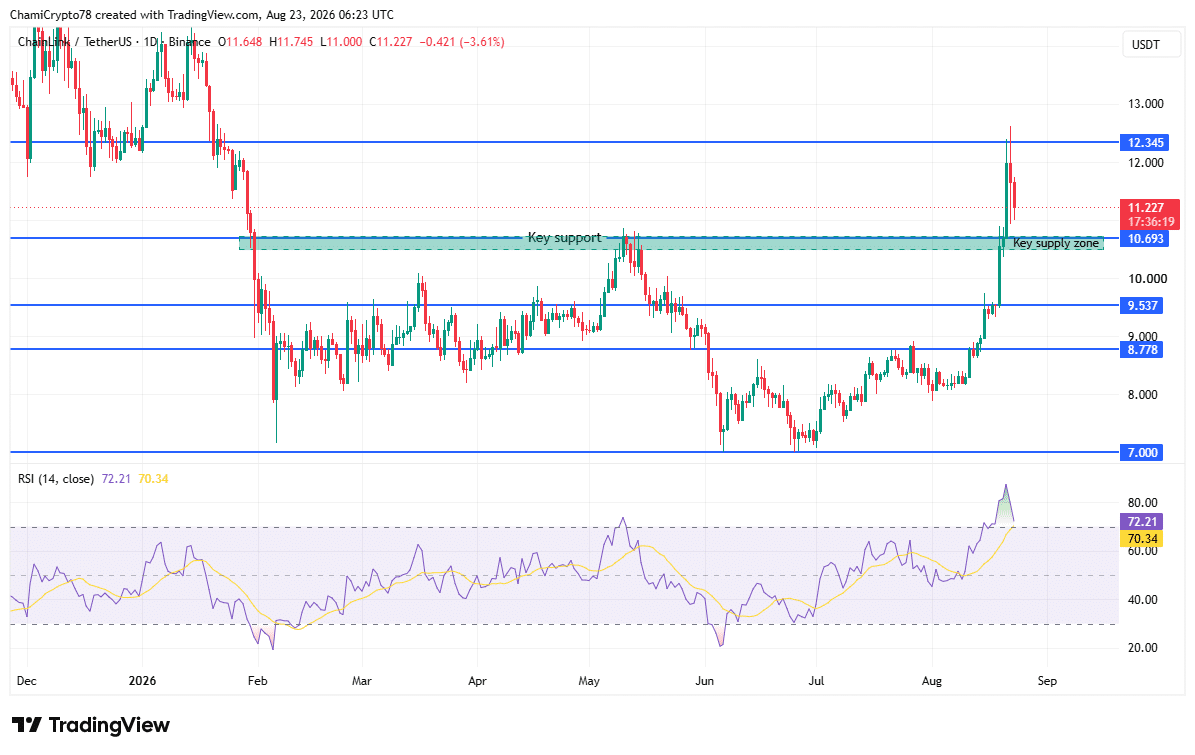
On the daily chart, LINK rallied strongly up to the $9.537 and $10.693 levels, with buyers finally pushing the price up towards the $12.345 resistance area.
Sellers then pushed back hard, pushing LINK back to the $11.227 level, but holding the $10.693 breakout zone intact. Notably, at the time of writing, RSI fell from about 88 to 72.21 after the buying wave, indicating a decrease in buying activity.
The indicator remained above 70, keeping overbought conditions relevant despite its retreat from the extreme reading. If the price stays above $10.693, then Chainlink’s most recent structural breakout would continue despite the less participation from the derivatives market.
Buyers could then challenge $12.345 again if selling pressure eases and exchange outflows continue. Alternatively, losing the $10.693 support level would expose the $9.537 support zone, while deeper weakness could bring $8.778 back into focus.
Final Summary
- Chainlink’s $8.35 million spot outflow countered the whale’s $2.3 million Coinbase deposit.
- Holding $10.693 could preserve LINK’s recovery despite declining RSI and Open Interest..





Be the first to comment