



Bitcoin has rebounded from its late June lows, climbing back above $64,000 even as the Bitcoin treasury company Strategy, began monetising part of its Bitcoin holdings. At the same time, ETF inflows have slowly returned after June’s record outflows, helping the market absorb the additional supply surprisingly well. With Bitcoin now trading below the $64,500-$65,000 resistance zone, traders are watching closely for the first signs of a decisive breakout.
Donchian Channels are designed to help spot exactly that.
In this episode of Chart Decoder Series, we explore how traders use Donchian Channels to identify breakouts, confirm trends, and distinguish genuine momentum from sideways price action, using Bitcoin’s latest price action as a real-world example.
What are Donchian Channels?
Donchian Channels were developed by Richard Donchian, the trader widely regarded as the father of modern trend following.

The indicator consists of three lines:
- Upper band: Highest high over the last 20 candles on the selected timeframe.
- Lower band: Lowest low over the last 20 candles on the selected timeframe.
- Middle band: Midpoint between the two
Rather than predicting where price will go, Donchian Channels simply show whether Bitcoin is making new highs, new lows, or remaining stuck inside a trading range. The bands only move when price makes a fresh extreme, which is what makes a band break such a clean, objective signal.
How to read Donchian Channels
Donchian Channels are among the easiest indicators to read because the signal is visual and binary: price is either inside the range or breaking out of it.
- Price rides the upper band: Buyers are in control.
- Price rides the lower band: Sellers are in control.
- Price stays between the bands: The market is consolidating.
- Price crosses the middle band: Momentum may be shifting, but traders usually wait for a break of the upper or lower band before confirming a new trend.
The width of the channel also tells you how volatile the market has been.
- Narrow channel: low volatility, the range is tightening, a breakout may be building
- Wide channel: high volatility, a trend is already underway
- Channel expanding: a new move is gaining momentum
- Channel contracting: the market is calming down and coiling
Donchian Channels don’t predict direction. They simply show when price is breaking into new territory.
Channel width describes volatility, not direction. A narrow channel tells you a move may be coming; it does not tell you which way. Always combine a band break with price structure, support and resistance, or momentum indicators like RSI and MACD for confirmation.
Donchian Channels vs Bollinger Bands
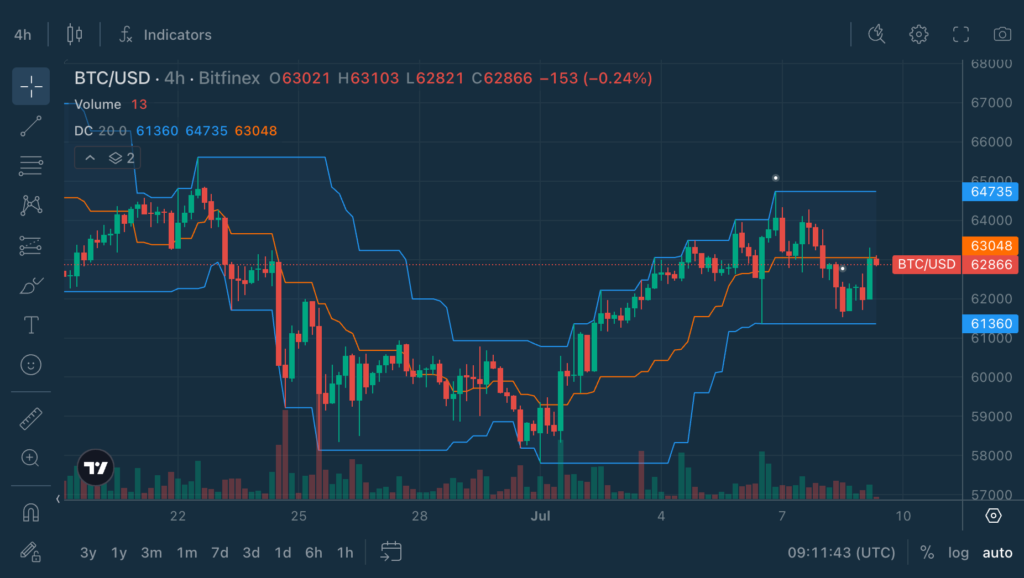
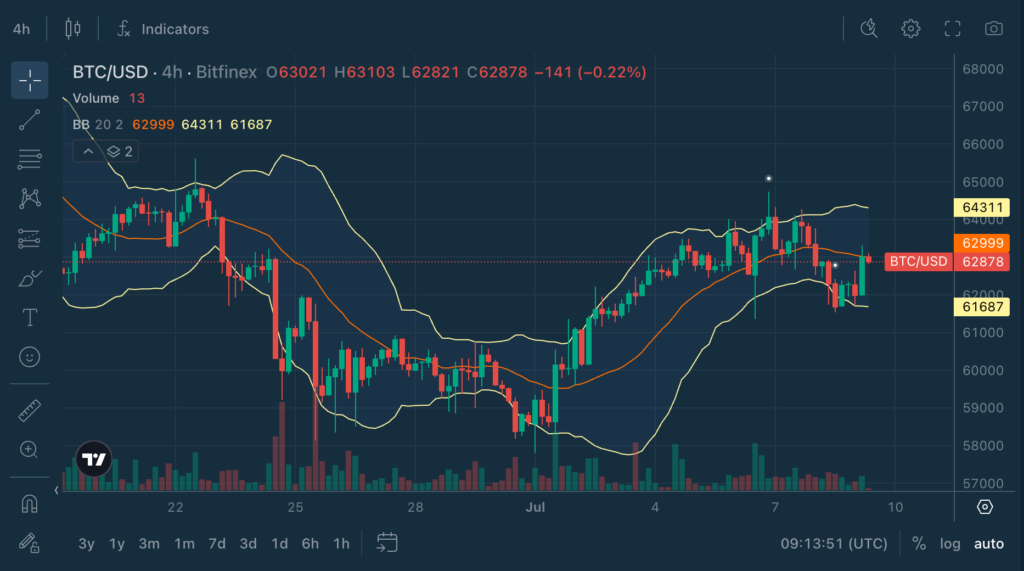
At first glance, Donchian Channels and Bollinger Bands look similar. Both wrap the price with an upper and lower band, but they measure very different things.
Donchian Channels track the highest high and lowest low over a chosen period. They’re designed to identify breakouts and trend changes. If Bitcoin closes above the upper band, it’s making a new high for that period. If it breaks below the lower band, it’s making a new low. Repeatedly riding the upper or lower band is often a sign of strength, not exhaustion. It means price keeps making new highs or new lows, showing the trend is still intact.
Bollinger Bands, on the other hand, are built around a moving average and expand or contract based on standard deviation, a measure of volatility. They help traders judge whether price is relatively stretched or compressed compared with its recent average. Repeatedly touching the upper or lower band can suggest price is becoming stretched and may eventually move back towards the average.
Think of it like this:
- Donchian Channels ask: Has price broken into new territory?
- Bollinger Bands ask: Has price moved unusually far away from its average?
Because of that, Donchian Channels tend to react best in strong trending markets, while Bollinger Bands are often more useful in range-bound markets, where traders look for moves back toward the average.

Donchian Channels in action
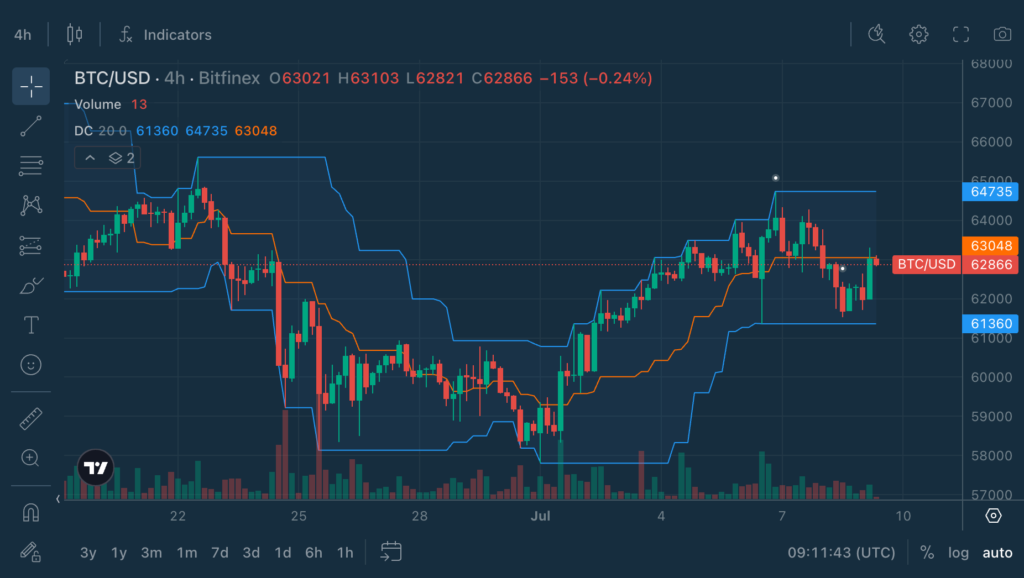
Let’s look at the BTC/USD 4-hour chart on July 9, 2026.
After bottoming around $57,800 on 1 July, Bitcoin began recovering steadily, printing a series of higher highs and higher lows. As price repeatedly pushed above the upper Donchian band, the indicator stepped higher with each new 20-period high, confirming the recovery was developing into a genuine uptrend rather than just a short-lived bounce.
Unlike Bollinger Bands, repeatedly trading along the upper Donchian band isn’t a sign Bitcoin is overbought. Instead, it reflects sustained buying pressure and a market that’s continuing to make fresh highs.
More recently, however, Bitcoin has struggled to break above the $64,700 area. Rather than hugging the upper band, price has drifted back towards the middle of the channel, suggesting momentum has cooled and the market has entered a period of consolidation.
The next signal is straightforward:
- A close above the upper band would mark a fresh 20-period high and suggest the uptrend is resuming.
- A close below the lower band would signal sellers are gaining control.
- As long as price remains inside the channel, Bitcoin is consolidating rather than trending.
Bonus Read: What the Daily Chart Is Telling Us
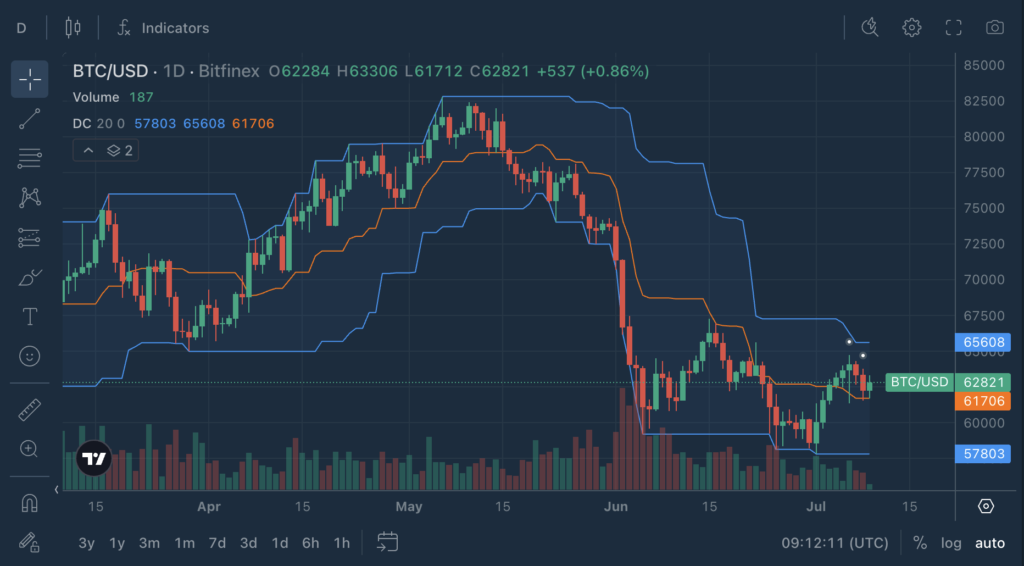
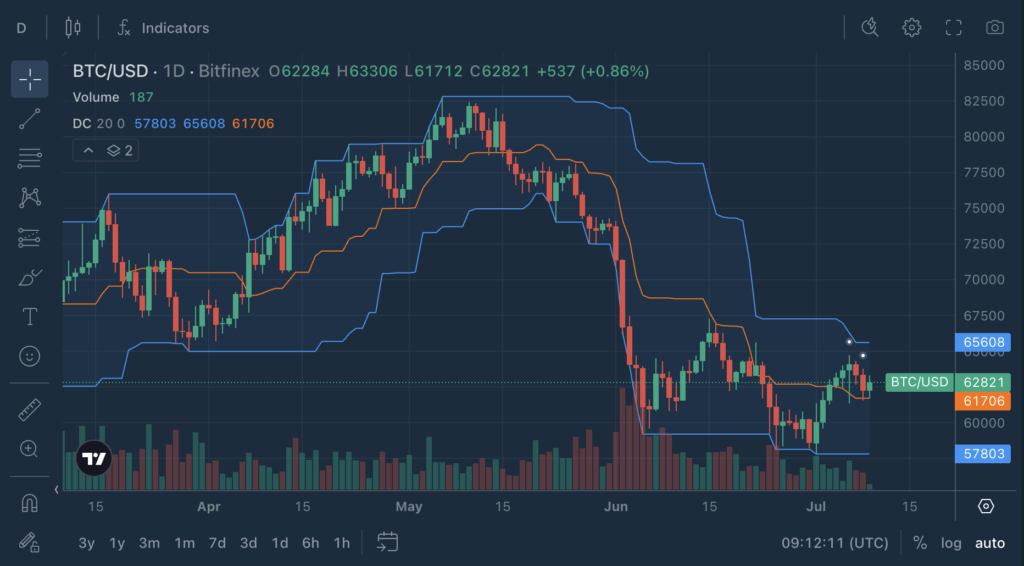
Zooming out to the daily chart on July 9, 2026, the bigger picture becomes clearer. While the four-hour chart captures shorter-term momentum shifts, the daily timeframe is more significant because it reflects the broader trend that longer-term traders and investors are watching.
Bitcoin’s sharp June sell-off pushed price below the lower Donchian band, confirming a new 20-day low and a decisive shift in momentum. The subsequent rebound from $57,800 has been encouraging, with BTC climbing back above the middle band and beginning to print higher lows.
However, the daily chart shows that the recovery still faces an important test.
The upper Donchian band sits around $65,600, marking the highest price reached over the past 20 trading days. Until Bitcoin closes above that level, the Donchian Channel continues to classify the market as trading within its recent range, rather than beginning a fresh breakout.
In other words, the daily chart suggests the recent rally has improved Bitcoin’s technical outlook, but it hasn’t yet confirmed a new uptrend.
For Donchian traders, the next signals are clear:
- A daily close above the upper band (~$65,600) would create a new 20-day high and provide one of the first objective signs that bullish momentum is expanding again.
- A rejection below the upper band would suggest Bitcoin remains range-bound.
- A move back towards the lower band (~$57,800) would indicate sellers are regaining control.
One of the biggest strengths of Donchian Channels is their simplicity. Rather than trying to predict where Bitcoin should go next, they help traders stay focused on what price is actually doing: making new highs, making new lows, or simply trading sideways.
How to use Donchian Channels like a pro
Use band breaks to catch trends
- Breakouts that align with the larger trend tend to be the most reliable.
- Breakouts against the prevailing trend are more likely to fail and should be treated with caution.
Do not chase every tag in a range
- Wait for a decisive close beyond the band, not just an intraday wick.
- In a clear range, fading band tags back toward the midline can work, but only while the range holds.
Use the middle band as a trend filter
The midline is an underrated part of the tool.
- While price holds above the middle band, momentum favors buyers.
- While price stays below it, sellers have the edge.
- A loss of the midline after an uptrend can be an early warning that the move is tiring.
Pair it with structure
A band break means more when it lines up with something real.
- A breakout above the upper band that also clears a major resistance level carries far more weight than a break in empty space.
- A breakdown below the lower band that also loses key support is a stronger bearish signal.
Power combinations
- Donchian Channels + Moving Averages
Moving averages define the bigger trend; Donchian Channels time the entry.
- If price is above the 50-day moving average and breaks the upper band, the bullish breakout has supportive context.
- If price is below the 50-day moving average and breaks the lower band, the bearish breakout has more weight.
- Donchian Channels + RSI
RSI tells you how stretched the move is.
- A break above the upper band while RSI is strong but not yet overbought suggests the breakout has room to run.
- A band break on fading or divergent RSI is more likely to be a fakeout.
- Donchian Channels + ATR
ATR confirms whether the breakout is backed by genuine volatility.
- A band break on expanding ATR signals real conviction behind the move.
- A band break while ATR is flat or shrinking may be a low-energy false start.
- Donchian Channels + Support and Resistance
- A breakout through the upper band that also clears horizontal resistance is a high-quality signal.
- A breakdown through the lower band that also loses major support warns of further downside.
This helps traders avoid treating every band break as equal.
Try it on Bitfinex
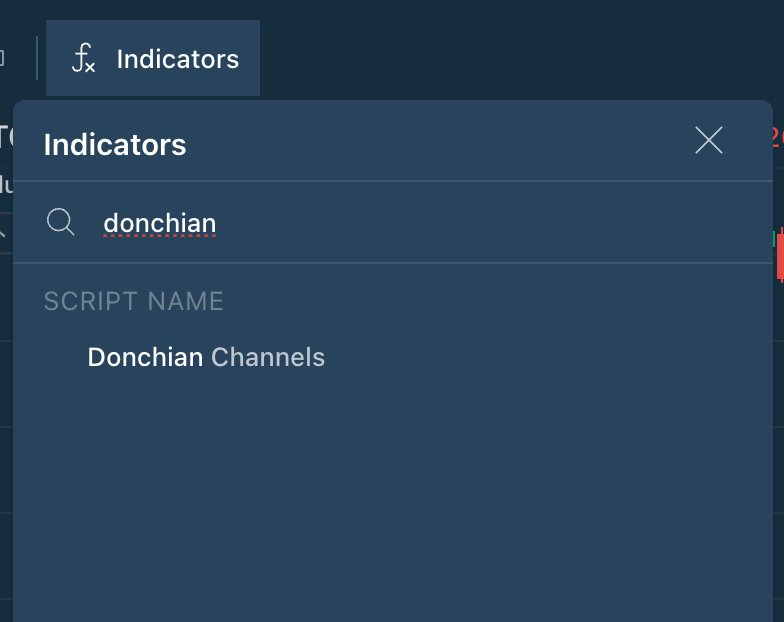
- Log into Bitfinex
- Choose any trading pair chart
- Add “Donchian Channels” from the Indicators menu
- Set your lookback period (20 is a common starting point; shorter periods react faster, longer periods filter more noise)
- Watch whether price is riding a band, sitting at the midline, or breaking out of the range. Use it alongside RSI, ATR, or moving averages for stronger confirmation
- Leverage Bitfinex’s zero trading fees to implement your strategies with zero trading costs

Bitfinex. Master Your Universe.
Explore the full Chart Decoder library:




Be the first to comment