


Another round of selling pressure is being applied to Shiba Inu, but one metric has caught traders’ attention with its magnitude and arithmetic impossibility.
Futures flows flip
Derivatives data claims that SHIB’s futures flow fell by as much as 1,418 percent over the course of eight hours. This is a striking figure that, at first glance, seems nearly impossible.
The important point is that price performance is not determined by percentage changes in futures flow. Rather, they monitor the movement of net capital into and out of derivatives markets. Percentage calculations can yield seemingly ridiculous numbers that surpass 100%, 500%, or even 1,000% when the flow from the previous period was relatively small and the most recent reading swung significantly negative.

Rather than a direct loss of value, the figure in SHIB’s case indicates a sharp change in trader positioning. Net flow statistics sharply declined as futures traders quickly shifted from increasing exposure to aggressively lowering it.
You Might Also Like

This interpretation is supported by more comprehensive market data. Spot flows are still negative, and futures outflows continue to dominate over a number of tracked timeframes. Five-day and three-day spot flows are still firmly in the red, and seven-day spot flows show net outflows of over $4.4 million. This suggests that spot investors and speculative traders have been lowering their exposure at the same time.
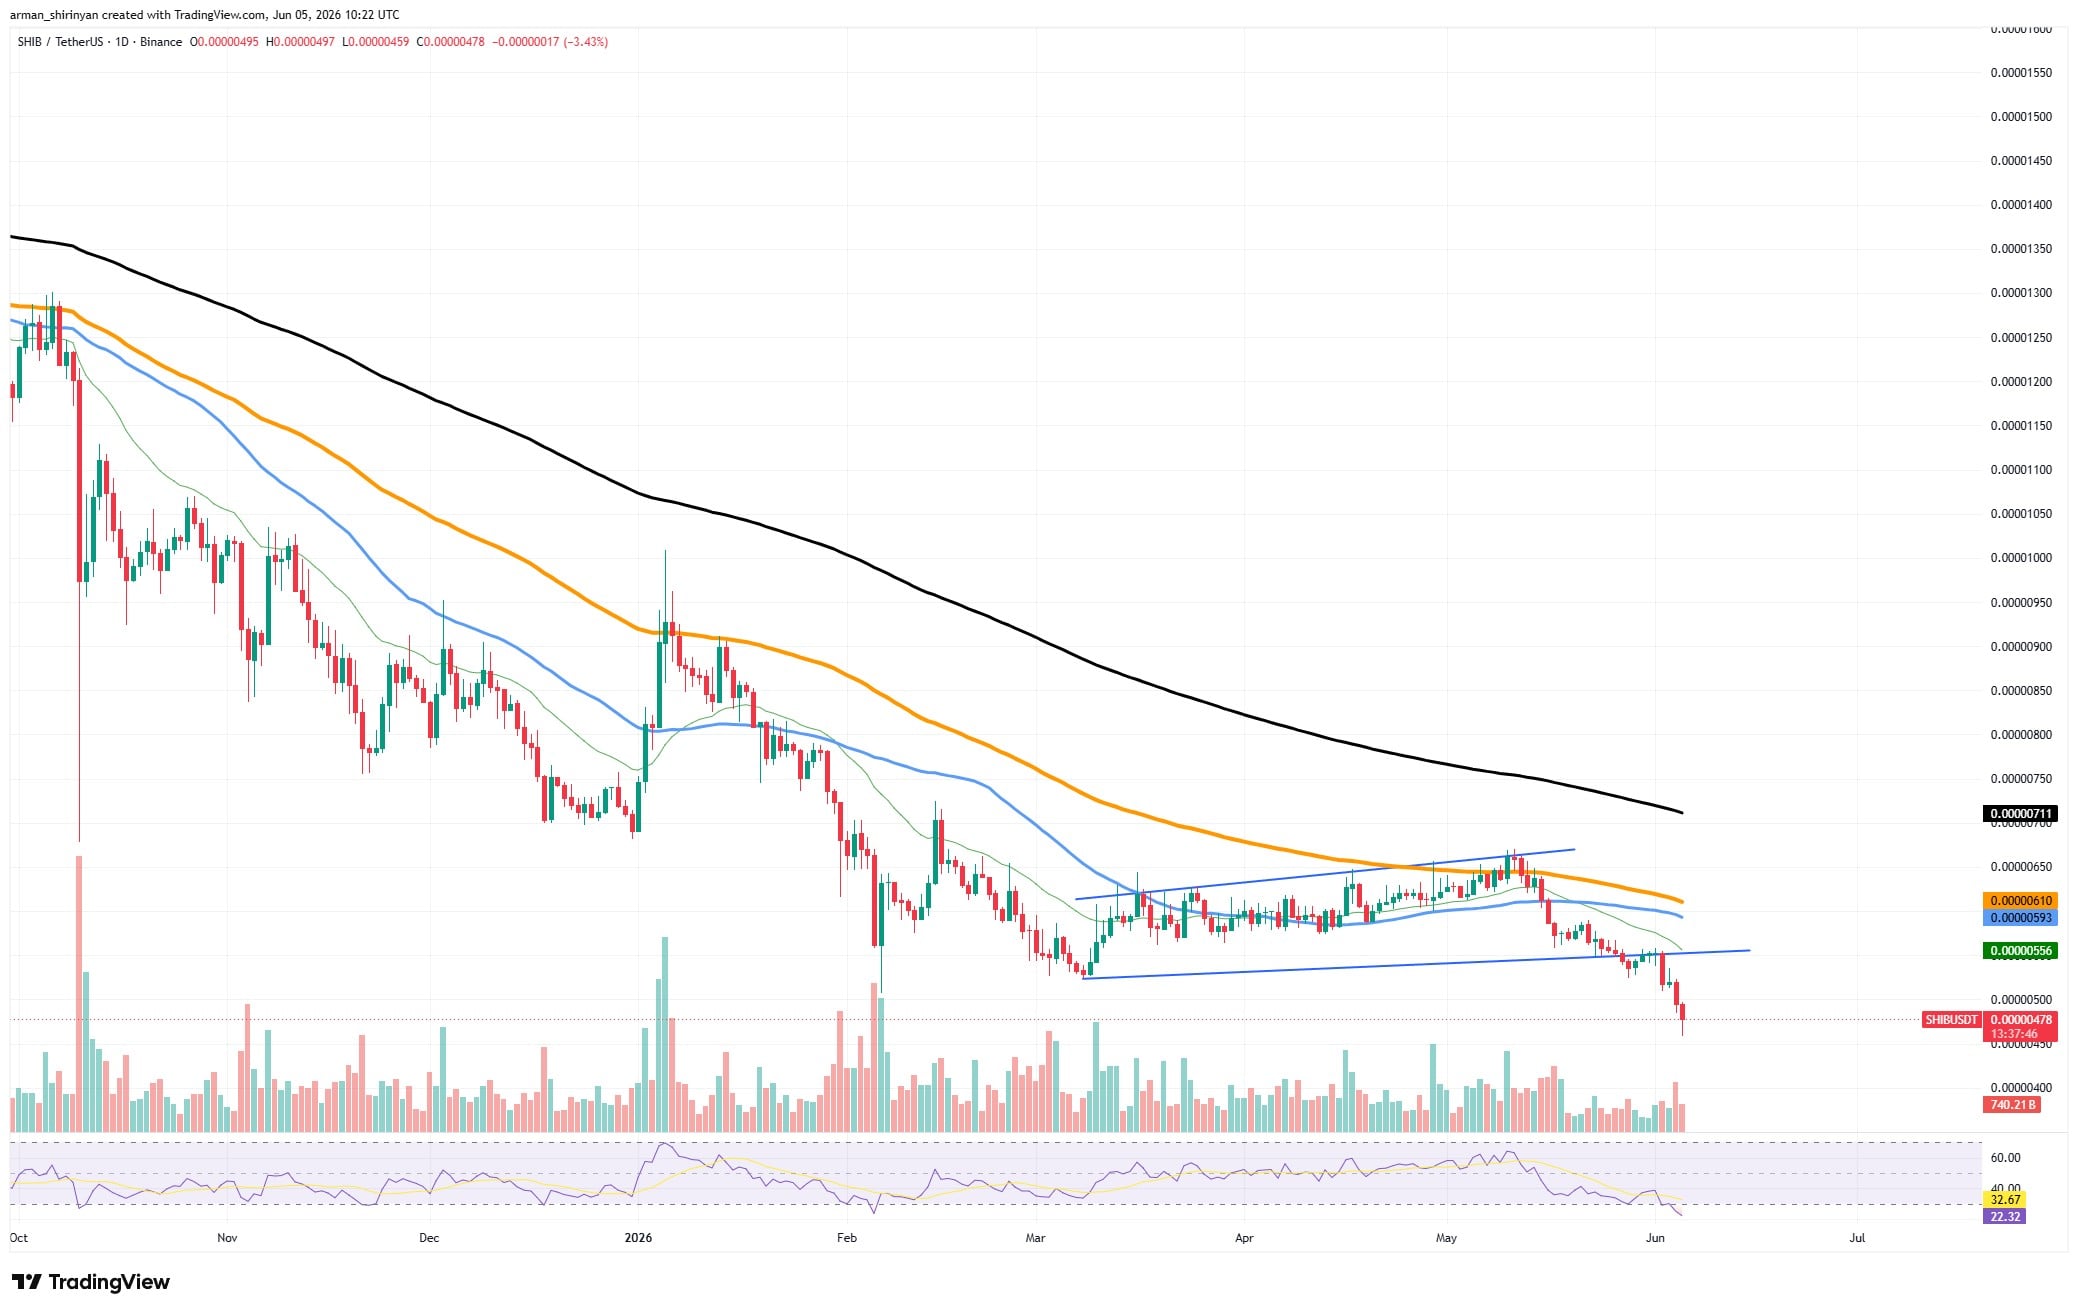
Trend is under bear’s control
Metrics from on-chain exchanges present a similar image. The total exchange outflows exceeded the inflows by about 586 billion SHIB, totaling over 802 billion SHIB. Although significant exchange outflows may occasionally be seen as accumulation, the current situation indicates that investors are repositioning in the face of uncertainty rather than actively purchasing the decline.
The chart is still in the negative zone. SHIB is still trading below its important moving averages after breaking below the lower boundary of a multi-month consolidation structure. While sellers continue to control the trend, momentum indicators are still weak, with the RSI hovering close to oversold territory.
You Might Also Like
Extreme futures flow readings frequently appear close to times of increased volatility despite the pessimistic outlook. Even a small catalyst can cause abrupt short-term reversals when positioning becomes overly one-sided.
But for the time being, spot and derivatives markets show that SHIB risk appetite has sharply declined. Although the reported 1,418% decline in futures flow may seem startling, it mainly illustrates how quickly traders have left leveraged positions, as the market is still dominated by bearish sentiment.

Be the first to comment