



DOGE trades near $0.0989 as traders track its 1.618 Fib history, $0.096 support, and $0.116 resistance amid early-season calls.
Dogecoin analysts are watching a possible early-season setup as DOGE enters another key technical phase.
Past cycles saw the token move above the 1.618 Fibonacci level, while the current daily chart shows weak momentum near $0.100, with support around $0.096 to $0.098 and resistance near $0.116 still in play ahead.
Traders Watch DOGE Fibonacci Setup
Some market analysts said DOGE has crossed its 1.618 Fibonacci level in earlier early-season cycles.

They are now watching whether a similar pattern can form again. One analyst said the setup could support a “2,740%” move if past cycle behavior repeats.
With $DOGE surpassing its 1.618 Fib Level in every alt season prior to this one and another alt-season looking extremely likely, we watch for another massive move to do so again!
That can include an over 2,740% (>28X) move to ~$2.85 and higher and this move could begin in any… pic.twitter.com/eH1vJfO7iM
— JAVON⚡️MARKS (@JavonTM1) May 28, 2026
The same outlook placed a possible long-term target near $2.85. However, this remains a market projection, not a confirmed move.
Dogecoin would need strong volume, wider altcoin demand, and clear trend recovery before such levels return to focus.
Altseason calls have increased as traders monitor capital rotation across crypto assets. Dogecoin often gains attention during meme coin rallies.
Yet current price action shows that buyers still need to regain control on the daily chart.
DOGE Price Weakens Near $0.100
DOGE/USD traded near $0.0989 after falling about 2.73% on the latest daily candle.
The token failed to hold the May recovery above the $0.110 to $0.115 area. Sellers then pushed the price back toward the key $0.100 zone.
The broader chart remains corrective after the January decline from around $0.145.
DOGE later found support near $0.085 to $0.090 in February and April. It recovered in early May, but the move stalled near $0.116.
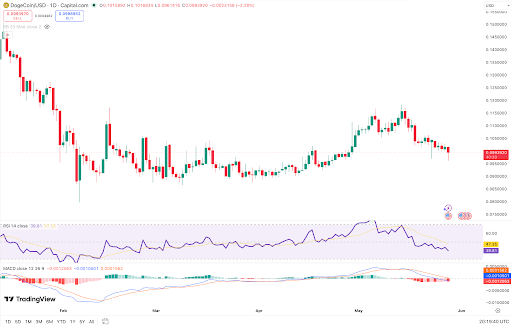
The immediate support area sits between $0.096 and $0.098. DOGE is testing that range now, and traders are watching the daily close.
A break below it could expose $0.092, followed by $0.085 to $0.088. On the upside, DOGE needs to regain $0.100 to $0.102 first.
A move above that range could reduce short-term selling pressure. The next resistance sits near $0.105, then $0.110 to $0.116.
Read Also:
Dogecoin Mirrors Past Cycles as New Accumulation Phase Fuels Bullish Momentum Up
Indicators Show Weak Momentum
The RSI stayed near 39, while its signal average was near 47. This reading showed weak momentum, and it did not show deep oversold conditions.
That leaves room for further downside before a stronger rebound develops. The MACD also remained bearish on the daily chart.
The MACD line stayed below the signal line, and the histogram remained negative. This showed that short-term momentum continued to favor sellers.
For a stronger recovery, DOGE needs to break above $0.116. That level marked the failure point of the last rally.
A clean move above it could shift attention back to higher resistance zones.
For now, Dogecoin breakout hopes remain tied to early-season momentum and technical recovery.
The chart stays bearish to neutral while DOGE trades below $0.105. A close below $0.096 would keep lower supports in focus.



Be the first to comment