


What to know:
- Dogecoin is testing key support levels that could determine whether it begins a long-term recovery or extends its correction.
- DOGE holders, short-term traders, and investors watching the broader meme coin market.
- Bulls must defend support and break major resistance before technical targets above $0.70 and $1 become realistic.
Dogecoin is back in the spotlight because some technical indicators resemble previous market bottoms. Even though the meme coin continues to be weighed down by the bearish trend that has lasted for months now, the recent price action and momentum metrics have sparked hopes that a big move might be imminent.
Analyst Hailey offered Elliott Wave analysis showing that Dogecoin is still trading within an extended correction move and not moving into a fresh bear trend.
The current move down is seen as the last leg of Wave (IV) after the big rally where DOGE achieved an all-time high back in 2021.

Also Read: Ripple’s Bold 2026 XRP Ledger Lending Plan for Institutions
Triangle Pattern Keeps Long-Term Bullish Case Alive
Dogecoin continues to trade inside a wide-range correction pattern and continually tests crucial support levels. A downward-sloping trend line has prevented all rallies from going any higher since the recent 2024 highs.
Hailey suggested that the triangle pattern will remain the highest-probability pattern if previous Elliott Waves follow suit, pointing out that DOGE is around 30% above the invalidation point. The chart reveals that the Wave 4 support zone is the most important one to defend.

Source: X
The ability to stay above this will preserve the long-term view and allow for a Wave (V) advance to the range of $1.00-$1.10, which means upside potential of more than 1,090% from the target bottom. Nevertheless, another period of consolidation will follow.
Oversold RSI Revives Memories of Previous Dogecoin Rally
Another technical trading signal emphasized by Trader Tardigrade is that of Dogecoin’s weekly Relative Strength Index, which is currently back to where it was at the previous market bottom.
During the bear market year of 2022, Dogecoin’s weekly RSI fell to this level before climbing by around 886% to close near $0.48.

Source: X
The present situation resembles the above-mentioned scenario, making the trader expect that there might be an attempt to reach the $0.70 zone should history repeat itself.
DOGE can also be seen staying close to the $0.07 support zone, which has seen some significant buy activity before. Although being oversold does not necessarily mean that a bullish reversal will occur, it indicates that the sellers are starting to lose steam.
BitMEX Long Positions Rise Despite Weak Price Action
Meanwhile, expert CW pointed to renewed buying activity on BitMEX, where long positions have increased sharply since June 24.
Open Interest increased from about 1 billion contracts to almost 1.7 billion contracts, indicating that new money is flowing into DOGE futures even as the coin’s price is hovering around monthly lows.
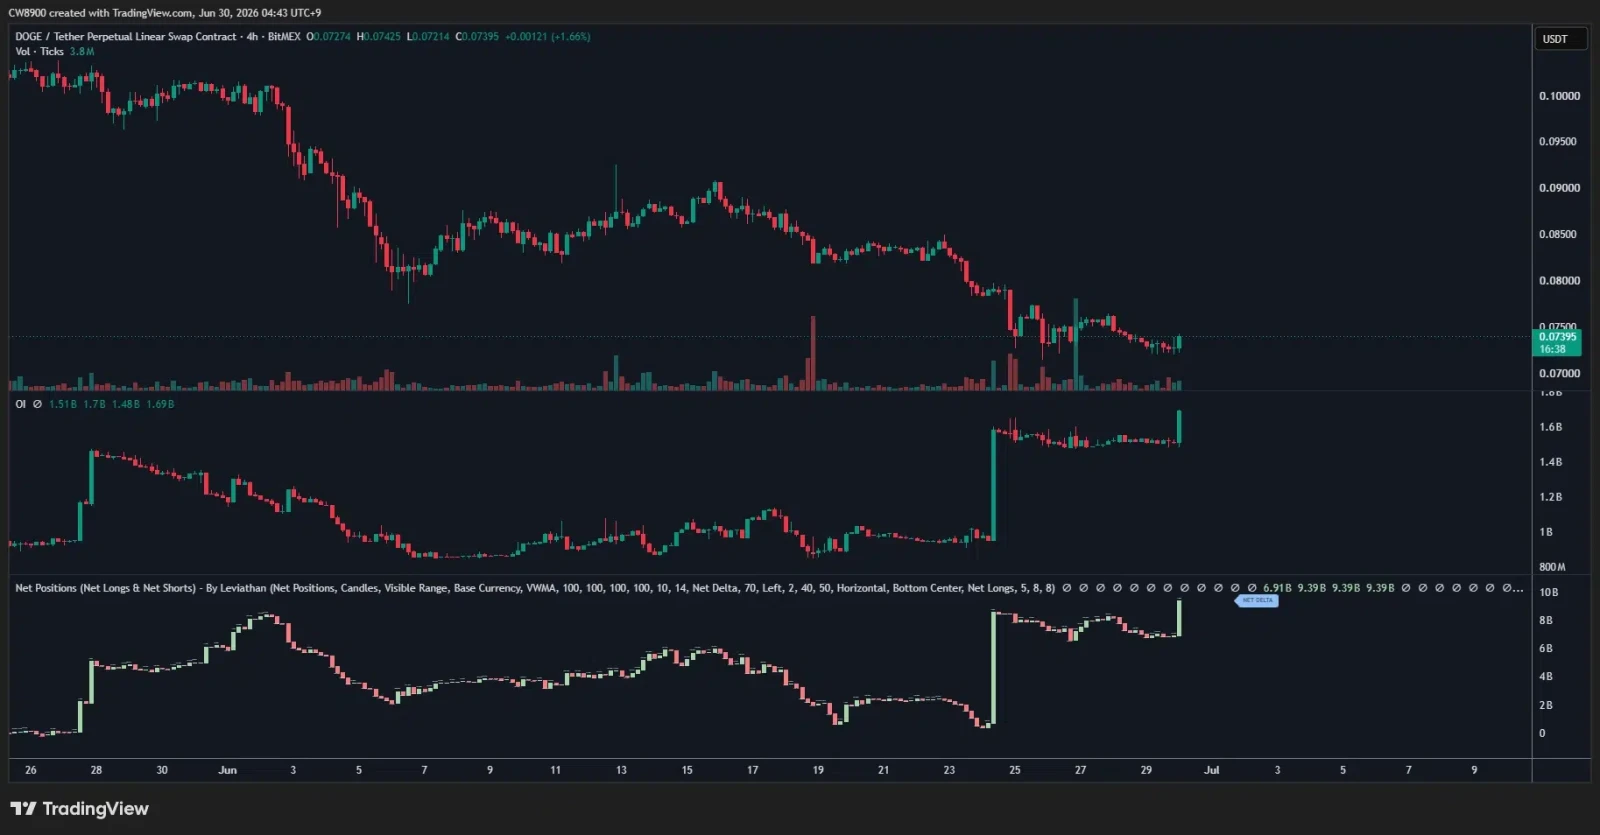
Source: X
The net long interest has also been on the rise, meaning that there are plenty of traders who are long on leverage, expecting the market to bounce back.
That being said, high net longs mean higher risks. If Dogecoin fails to break above resistance, the leverage may unwind swiftly.
This article contains market analysis and price predictions. These are not guarantees. Crypto markets are volatile. Always DYOR. Not financial advice.
Also Read: Australia’s Crypto Travel Rule: Bold Changes Start July 1

Be the first to comment