


What to know:
- ENS price holds steady near $6.16, gaining nearly 2% with rising momentum
- Ascending channel structure keeps buyers active below key resistance around $6.40
- Derivatives data shows growing trader participation with bullish positioning gaining ground

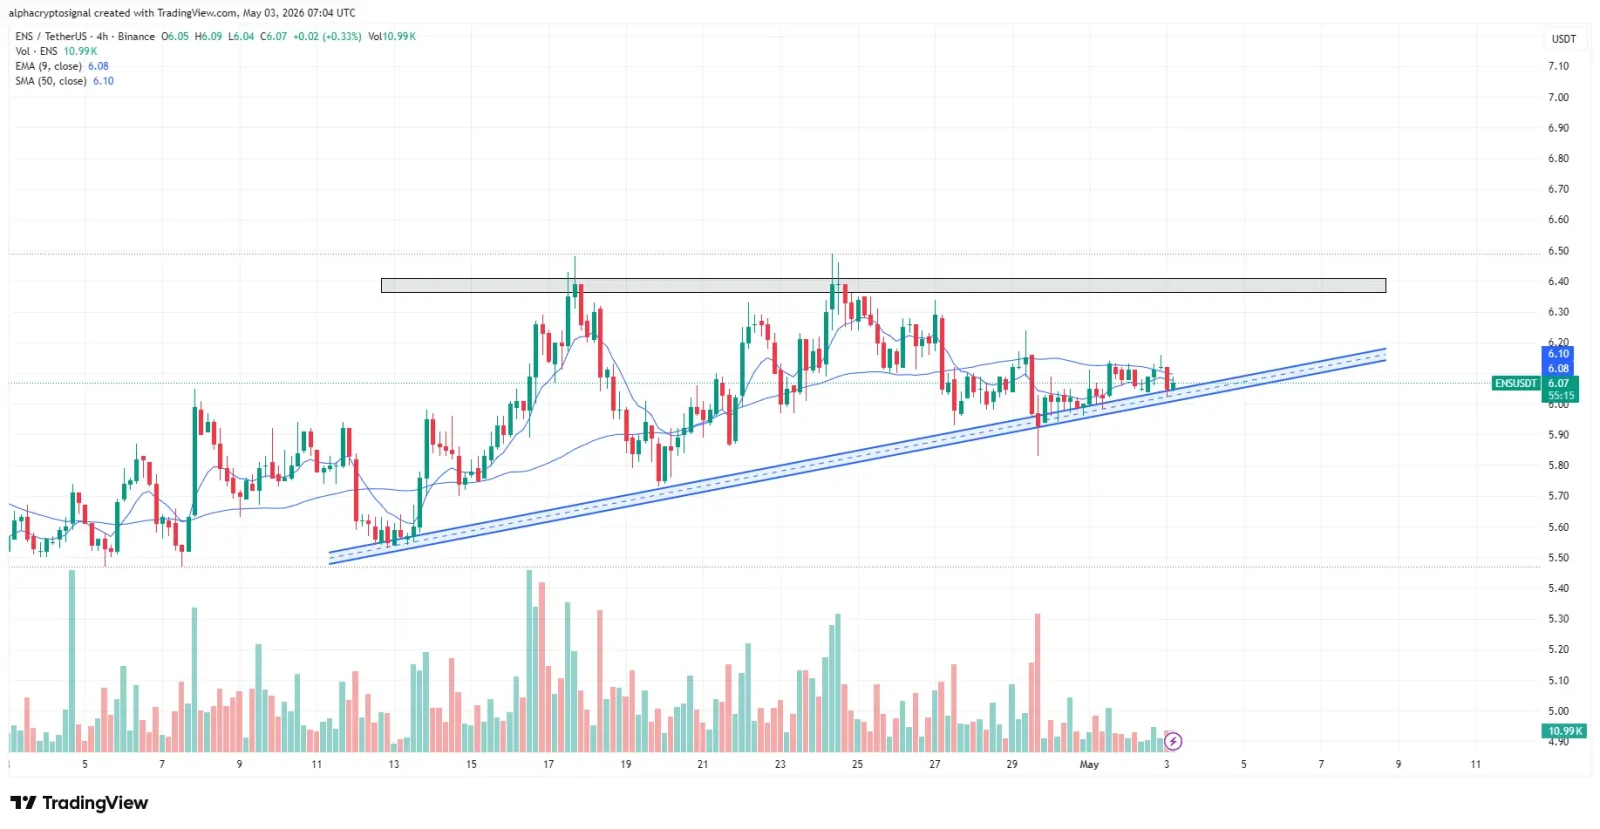
ENS price traded near $6.16 on May 3, rising 1.97% as short-term momentum strengthened, according to CoinMarketCap. The move places ENS price near a key resistance level that could determine its next directional trend.
The Ethereum Name Service price has formed higher lows and now approaches a critical resistance zone. According to Alpha Crypto Signal, ENS price remains within a defined ascending channel structure.
ENS Price Analysis Shows Ascending Channel Structure
In addition to the uptrend line supporting each higher-low formation, the trendline represents sustained demand over several trading days. Alpha Crypto Signal stated that compression of the Ethereum Name Service price below horizontal resistance near $6.40.

Such compression typically creates a foundation for significant volatility expansion in all cryptocurrencies. As noted by Alpha Crypto Signal, if support is held, it could prompt a possible bullish breakout.
If the ENS price breaks out past the resistance zone, it could indicate a potential price move into the $6.40-$6.60 region. However, if the ENS price fails to hold support and falls back through channel support, the entire bullish structure may be invalidated. This can lead to a bearish continuation set-up.
Also Read | SUI Holds $0.92 Support as Weak Momentum Targets $0.94–$0.96 Recovery
Futures Volume Indicates Increasing Demand
Futures volume on CoinGlass rose by about 4% to approximately $19.6 million, while open interest rose by 1.65%. Long positions held by Binance account holders outnumbered shorts as the ratio exceeded 1.14.
Furthermore, top traders’ positioning reflected an even more pronounced bullish bias with levels greater than 1.5. While longs continue to grow, however, they are not yet growing faster than shorts.
Thus, the long/short ratio remains under 1.0 overall, suggesting that while bull-bias is increasing among traders, there is no overwhelming majority favoring bulls. Funding rates have been mixed, reflecting alternating positive and negative prints.
This can reflect uncertainty as many investors await clear signs of which direction the next trend will take.
Technical Indicators Confirm Consolidation
As shown on TradingView charts, the ENS price is clustered near the 20-, 50-, and 200-period exponential moving averages (EMAs). Thus far, these clusters indicate that the cryptocurrency has entered a consolidation phase, as opposed to experiencing a significant directional breakout.
At present, the 200-period EMA (long-term support) is located at $6.04 and serves as a key technical indicator for determining long-term support for ENS. Additionally, the shorter-term 20- and 50-period EMAs ($6.07) represent a balance between buyers and sellers.
The RSI reading is currently at 58, representing moderate bullish momentum but not indicative of being overbought. The MACD is displaying a small bullish crossover.
Nevertheless, overall momentum remains limited. Therefore, based on this technical analysis, the ENS price appears to be consolidating in a range between $5.80 support and $6.40 resistance.
This article contains market analysis and price predictions. These are not guarantees. Crypto markets are volatile. Always DYOR. Not financial advice.
Also Read | Uniswap (UNI) Tests Key Support Zone as Bearish Structure Targets $4.20 Recovery Levels

Be the first to comment