



Ethereum is trading near $2,670 after its latest attempt to clear $2,800 stalled around $2,786, marking the first meaningful pullback since ETH broke out of its September range.
The decline follows a strong recovery that carried Ethereum from below $2,400 to almost $2,800. The second-largest crypto by market cap gained roughly 14% over seven days before the rally cooled, while its three-month advance reached about 75% and outpaced Bitcoin over the same period.
ETH’s price is now approaching support around $2,626 to $2,672, and holding that area would preserve the recent breakout and leave $2,786 to $2,800 as the first upside test. A deeper decline below $2,550 would weaken the structure and put $2,430 back into play.
Ethereum Pulls Back After Testing $2.8K
Ethereum reached approximately $2,786 before sellers pushed the price back below $2,700.

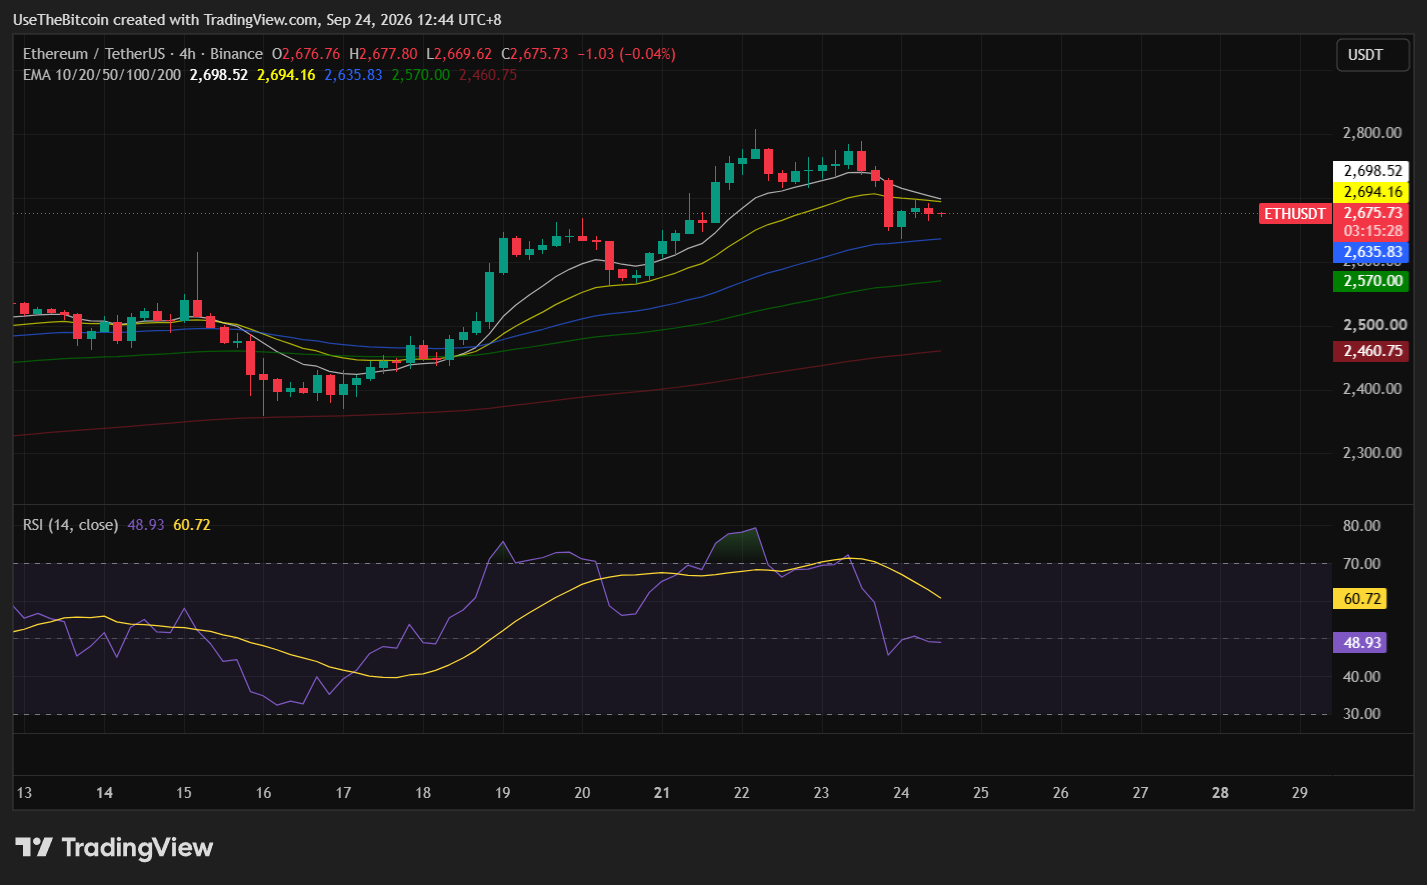
The pullback follows a rapid advance from the $2,400 area and does not yet represent a breakdown of the broader recovery. ETH remains above several important moving averages and above the resistance levels it reclaimed during the September rally.
The immediate follow-through is whether previous resistance around $2,626 to $2,672 can now act as support.
| Level | Role |
|---|---|
| ~$2,368-$2,430 | Deeper support zone |
| $2,544-$2,560 | Main short-term support |
| $2,626-$2,672 | Immediate support |
| ~$2,670 | Current price area |
| $2,762-$2,800 | Major resistance cluster |
| $2,894-$3,000 | Next upside resistance |
| ~$3,177 | Higher resistance |
| $3,300-$3,400 | Longer-term upside zone |
Table 1. Ethereum Key Support and Resistance Levels
A successful defense of $2,626 would leave the breakout structure largely intact. A close below roughly $2,550 would create a more meaningful technical setback.
$2.8K Remains the Immediate Resistance
Ethereum has now tested the $2,800 area without establishing a sustained breakout, creating a concentrated resistance zone between roughly $2,760 and $2,800.
A weekly close above $2,800 would strengthen the recovery and shift attention toward $2,900 to $3,000. A continued rejection would make the $2,550 area the next key downside test.
Leverage Remains Relatively Controlled
Ethereum’s derivatives market provides a different picture from the price rally.
Open interest (OI) is currently around 13 million ETH, little changed after a late-August short squeeze reduced outstanding positions by roughly 700,000 ETH.
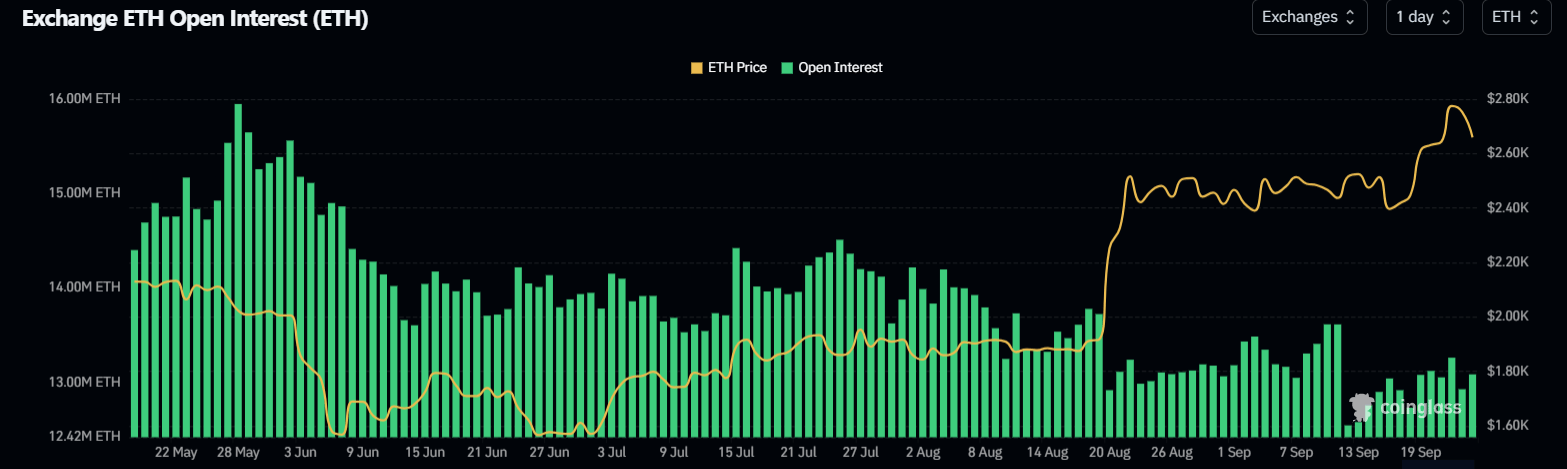
In dollar terms, open interest has risen to about $34.8 billion, but part of that increase reflects ETH’s higher market price rather than a comparable increase in leveraged ETH exposure.
Since the late-June low, Ethereum’s price has risen roughly 70%, while dollar-denominated open interest increased around 60%, suggesting leverage has not expanded faster than price during the recovery.
This differs from simply looking at the dollar value of open interest and concluding that speculative leverage is surging. Measured in ETH terms, positioning remains relatively subdued.
Lower leverage can reduce the risk of a heavily crowded long trade, although it also shows derivatives traders have not aggressively chased the rally.
Long Liquidations Rise as ETH Retreats
The latest pullback still caught leveraged traders on the wrong side. Approximately $109 million in Ethereum positions were liquidated over 24 hours, with long liquidations accounting for about $97.5 million, according to CoinGlass data.
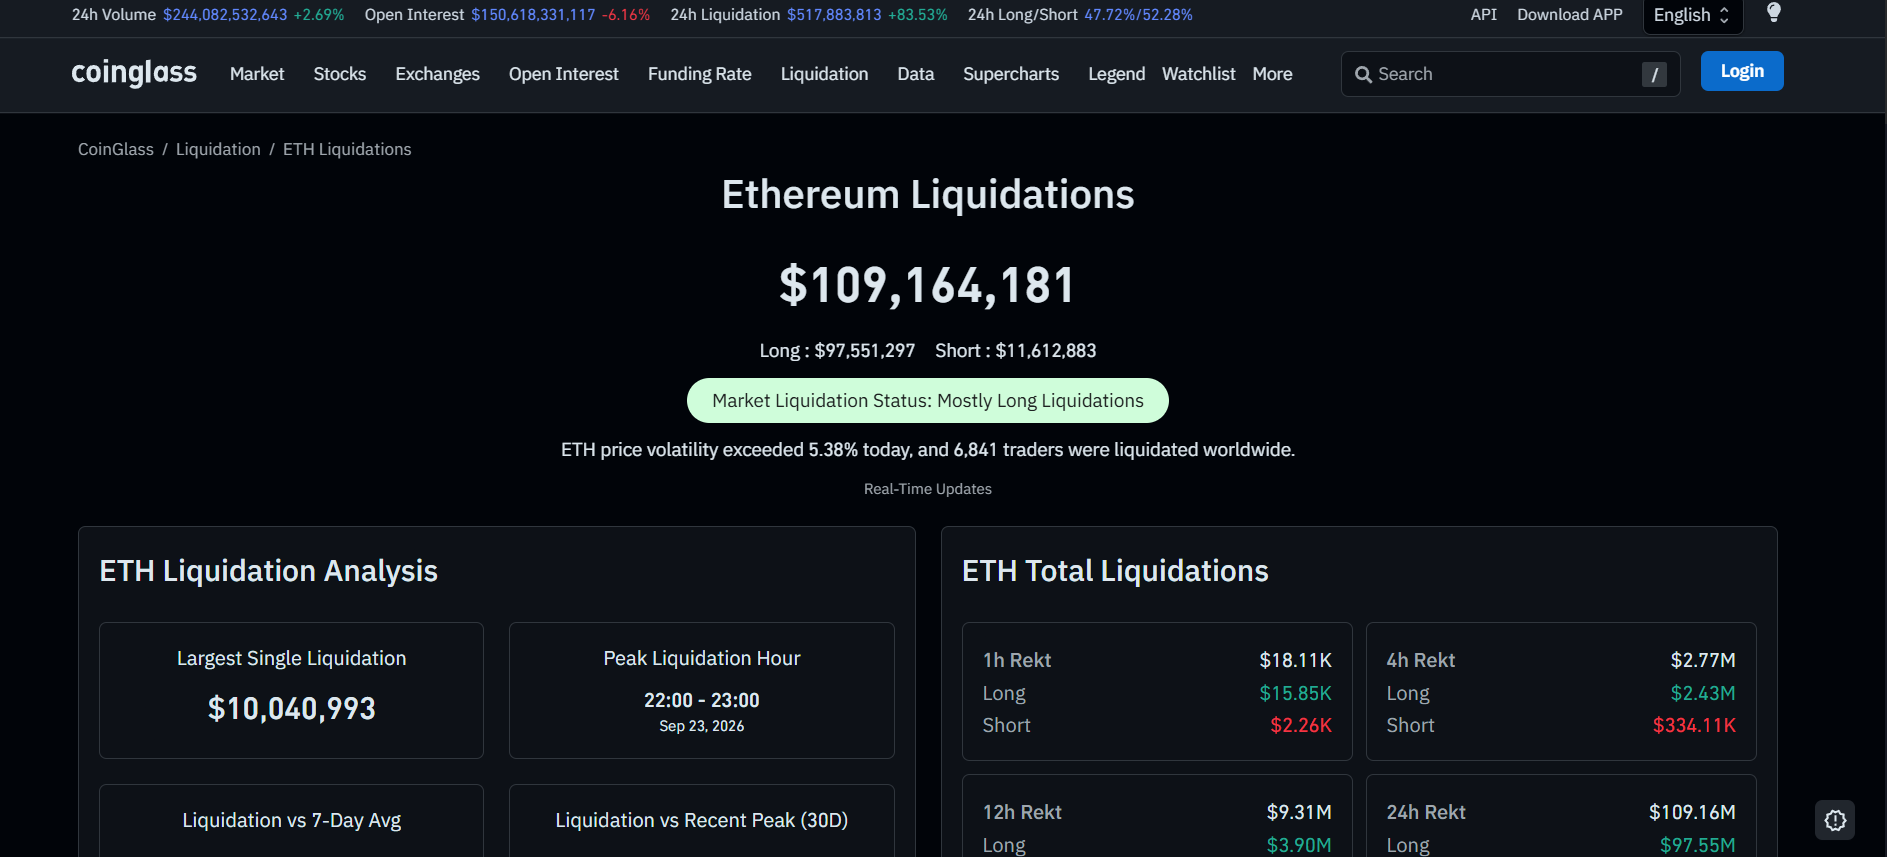
The current liquidation status is a cleanup of traders who entered leveraged long positions during the latest rally.
If ETH stabilizes above $2,626 while open interest remains controlled, the pullback could reset short-term positioning without materially damaging the larger trend.
Network Activity Has Not Matched the Price Rally
Ethereum’s price has recovered much faster than its base-layer activity. CryptoQuant data shows active addresses have remained broadly flat over the past three months, while Ethereum mainnet transaction counts have declined despite the strong price advance, creating a gap between price performance and Layer 1 activity.
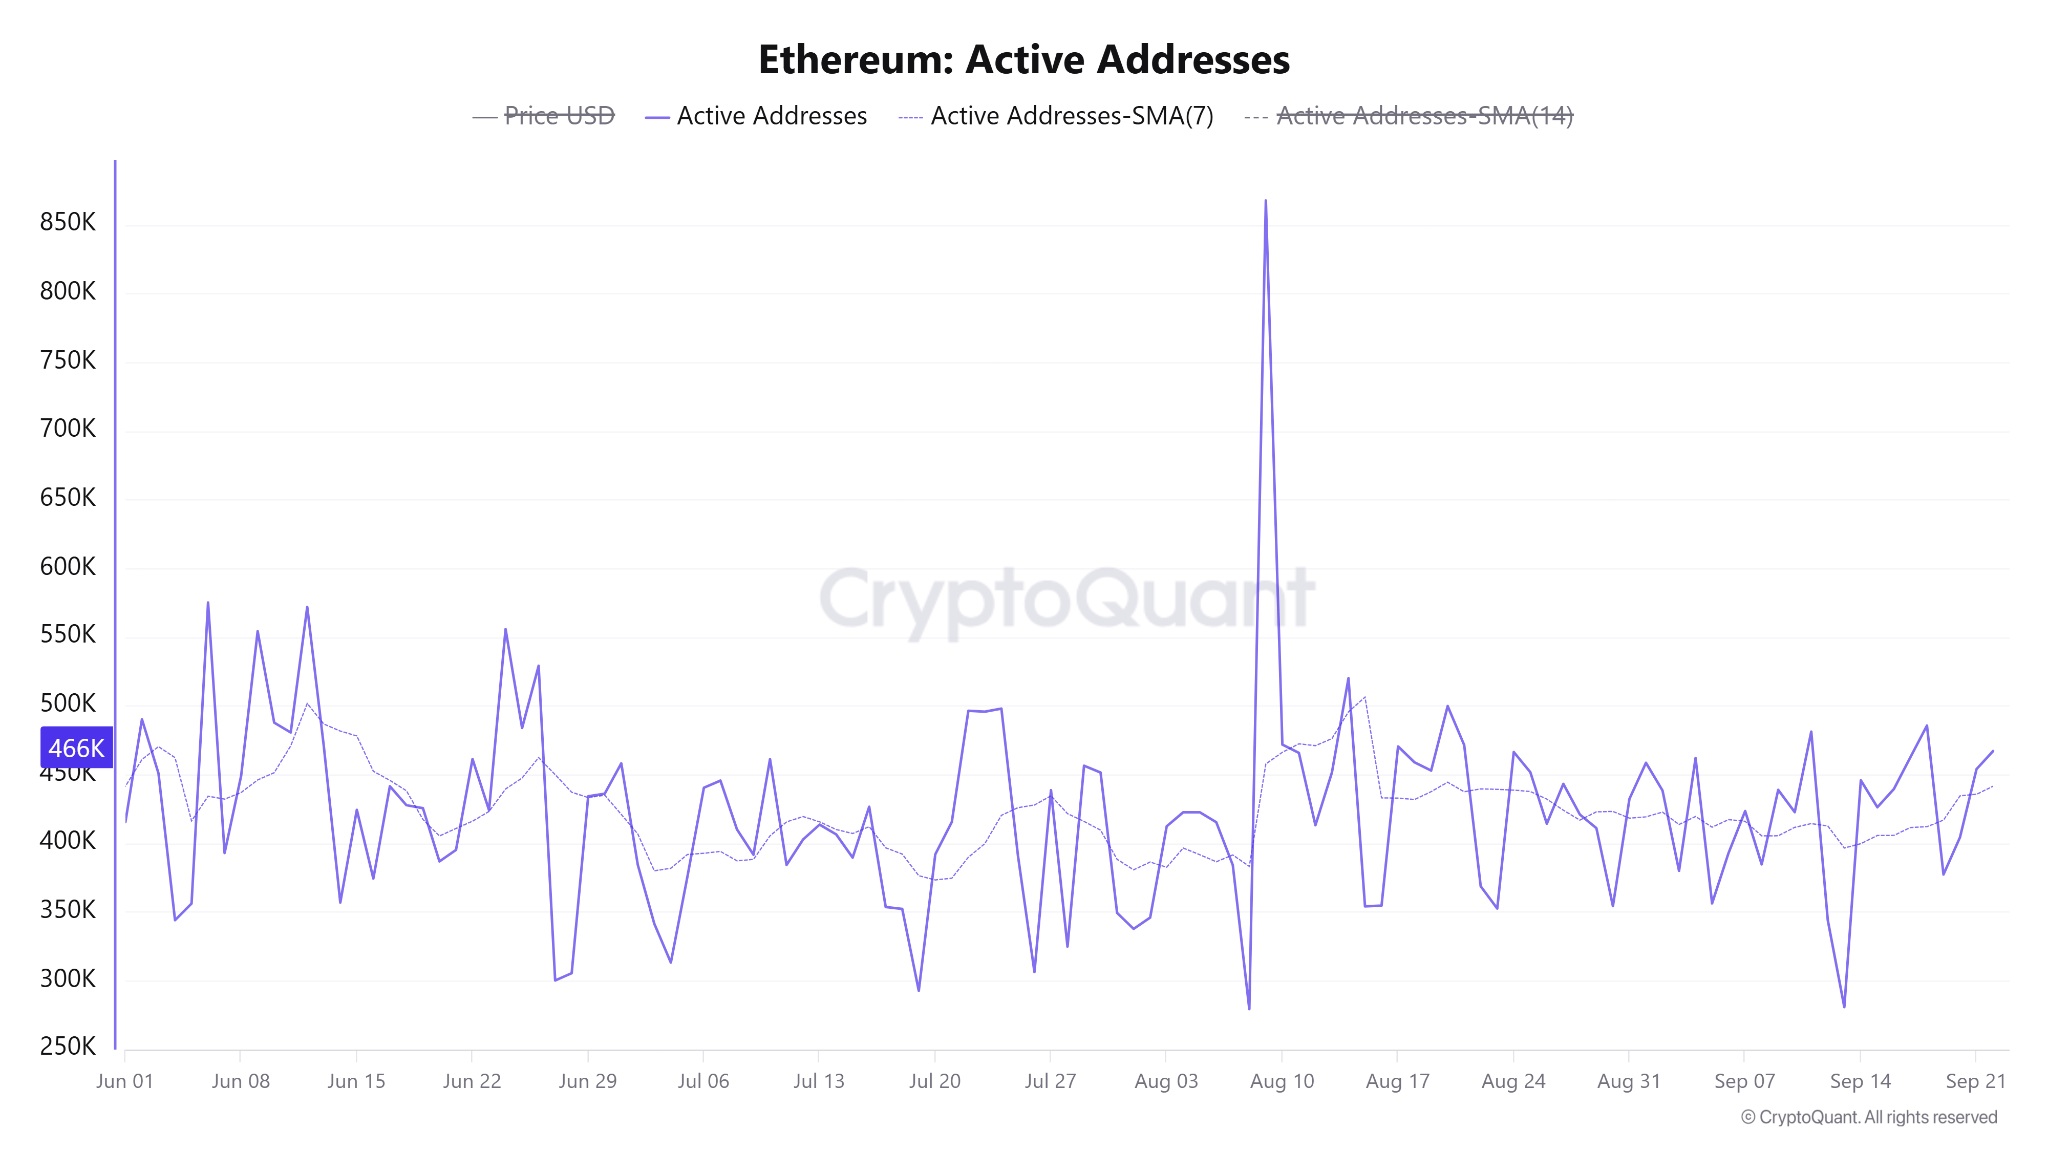
However, declining mainnet transactions should not automatically be interpreted as declining use of the broader Ethereum ecosystem. Recent network upgrades have expanded Layer 2 capacity, allowing more activity to occur away from Ethereum’s execution layer while still using Ethereum for settlement and data availability.
For the rally to gain stronger fundamental confirmation, continued growth across the broader Ethereum ecosystem would matter more than a short-term spike in mainnet transactions alone.
ETF Demand Improved Before the $2.8K Test
US spot Ethereum exchange-traded fund (ETF) demand also improved during the run toward $2,800. ETH ETFs recorded roughly $270 million in combined net inflows across two consecutive sessions earlier this week, reversing the preceding three-session outflow streak.
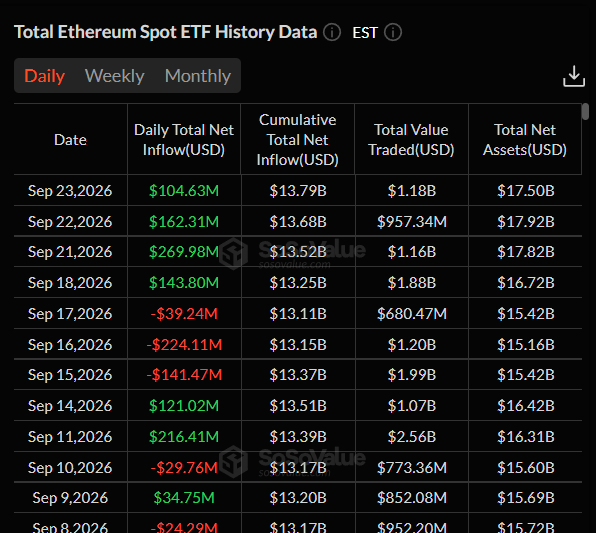
The recovery followed approximately $143.80 million in net inflows on September 18, with the latest positive sessions helping restore institutional demand after the mid-September withdrawals.
ETF flows can change quickly from one session to the next, so continued inflows would provide more useful confirmation than a single strong day.
If institutional demand remains positive while ETH holds above $2,600, the spot market would better support another attempt at $2,800.
$2.55K Is the Bigger Downside Level
The first support sits around $2,626, but the more important level is closer to $2,550.
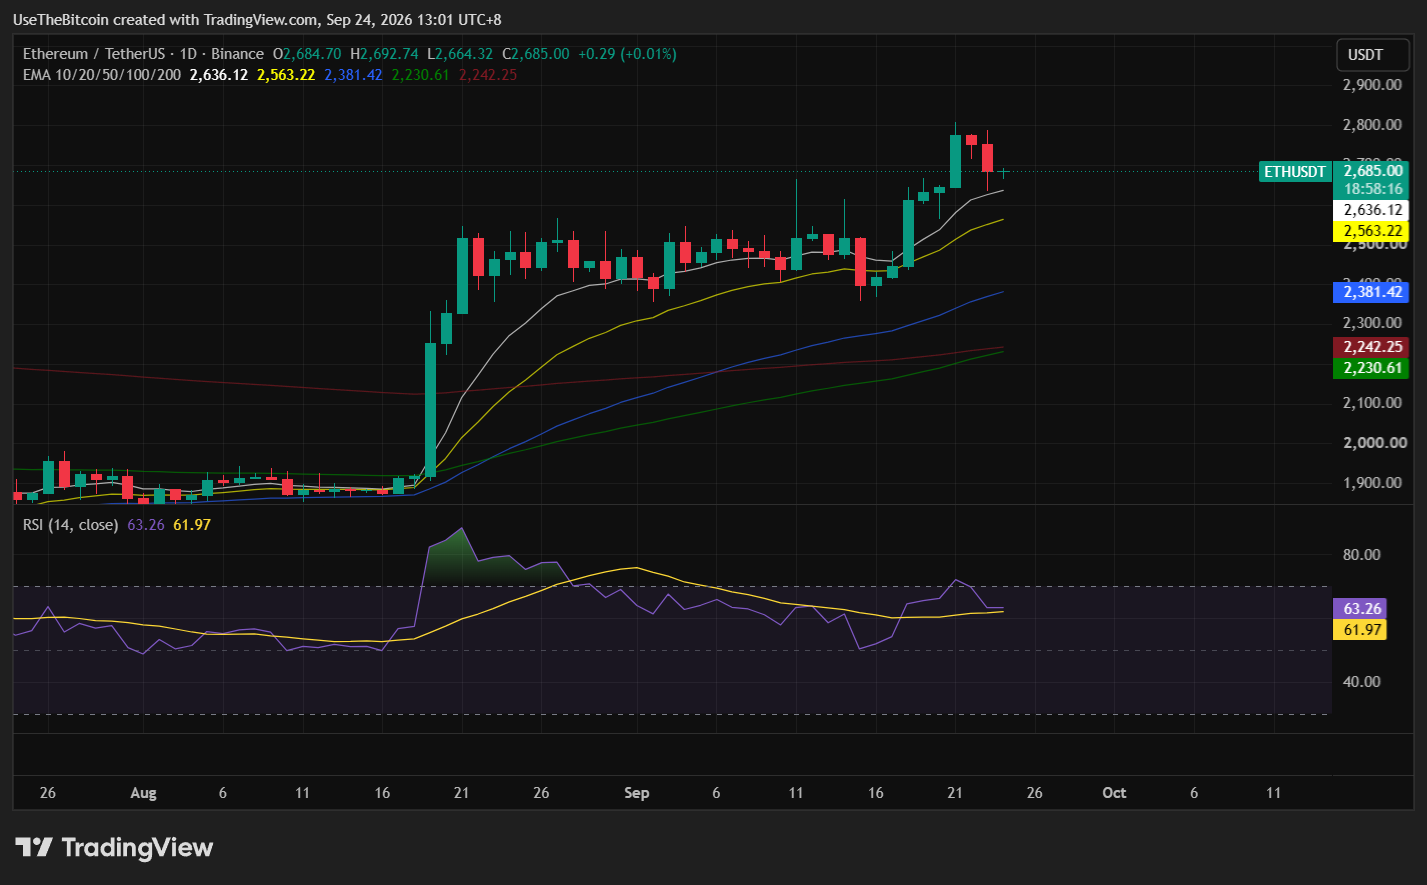
The 20-day EMA is approximately $2,563, while horizontal support sits around $2,544. The weekly chart separately places the 100-week EMA near $2,558.
Several technical measures therefore converge within a narrow $2,544 to $2,560 area. A pullback into that region could still fit within the broader recovery.
A decisive close below it would weaken the short-term structure and expose approximately $2,431, followed by the 50-day EMA near $2,368.
A Break Above $2.8K Would Put $3K Back in Focus
Ethereum has several resistance levels to clear before the larger $3,300 to $3,400 targets become relevant.
The first is $2,786 to $2,800. Above that, resistance appears around $2,894, followed by a wider supply zone between approximately $2,900 and $3,055.
The psychological $3,000 level sits inside that range. Only after ETH establishes itself above $3,000 would the higher targets around $3,177 and eventually $3,300 to $3,400 become more technically relevant.
The sequence avoids treating the $3,400 projection as an immediate target, since several significant barriers remain between the current price and that level.
| Scenario | Price Trigger | Possible Outcome |
| Bullish Case | ETH holds $2.63K-$2.67K and clears $2.8K | $2.9K-$3.05K becomes the next target zone |
| Base Case | ETH remains between $2.55K and $2.8K | Consolidation continues after the recent rally |
| Bearish Case | ETH closes below $2.54K-$2.56K | $2.43K and then ~$2.37K return to focus |
Table 2. Ethereum Price Scenarios After the $2.8K Rejection
Bottom Line
Ethereum’s rally has paused after ETH reached about $2,786 and failed to hold above $2,800.
The upside remains centered on $2,760 to $2,800. A weekly close above $2,800 would put $2,900 to $3,000 into play. If ETH loses $2,550 instead, the latest breakout would weaken, and approximately $2,430 would become the next major downside level.
This article is for informational purposes only and does not constitute financial advice. Crypto price predictions are based on analyst estimates and are not guarantees of future performance. Do your own research before making any investment decisions.
Frequently Asked Questions
Need a refresher? Here are some common questions about Ethereum’s current price setup.
Why Did Ethereum Fall Below $2,700?
Ethereum pulled back after reaching approximately $2,786 and failing to clear the $2,800 resistance area. The decline also triggered about $97.5 million in long liquidations over 24 hours as traders took profits and closed leveraged positions.
What Is Ethereum’s Most Important Support Level?
The immediate support area is around $2,626 to $2,672. The stronger technical support sits around $2,544 to $2,560, where horizontal support, the 20-day EMA, and the 100-week EMA converge.
Why Is $2,800 Important for Ethereum?
Ethereum has repeatedly struggled around $2,800. A sustained move above it would strengthen the case for a continuation toward $2,900 to $3,000.
Is Ethereum Open Interest Too High?
Dollar-denominated open interest is around $34.8 billion, but open interest measured in ETH remains near 13 million ETH and has been relatively stable. That suggests ETH’s higher price accounts for part of the rise in the dollar figure rather than leverage expanding dramatically faster than the market.
Could Ethereum Reach $3,000?
A move toward $3,000 becomes more relevant if ETH first closes above $2,800. The next resistance area sits around $2,900 to $3,000, so Ethereum would need to absorb that supply before a sustained move above $3,000 is confirmed.


Be the first to comment