




TLDR
- ETH price stalled below the $2,000 resistance after rising from nearly $1,520.
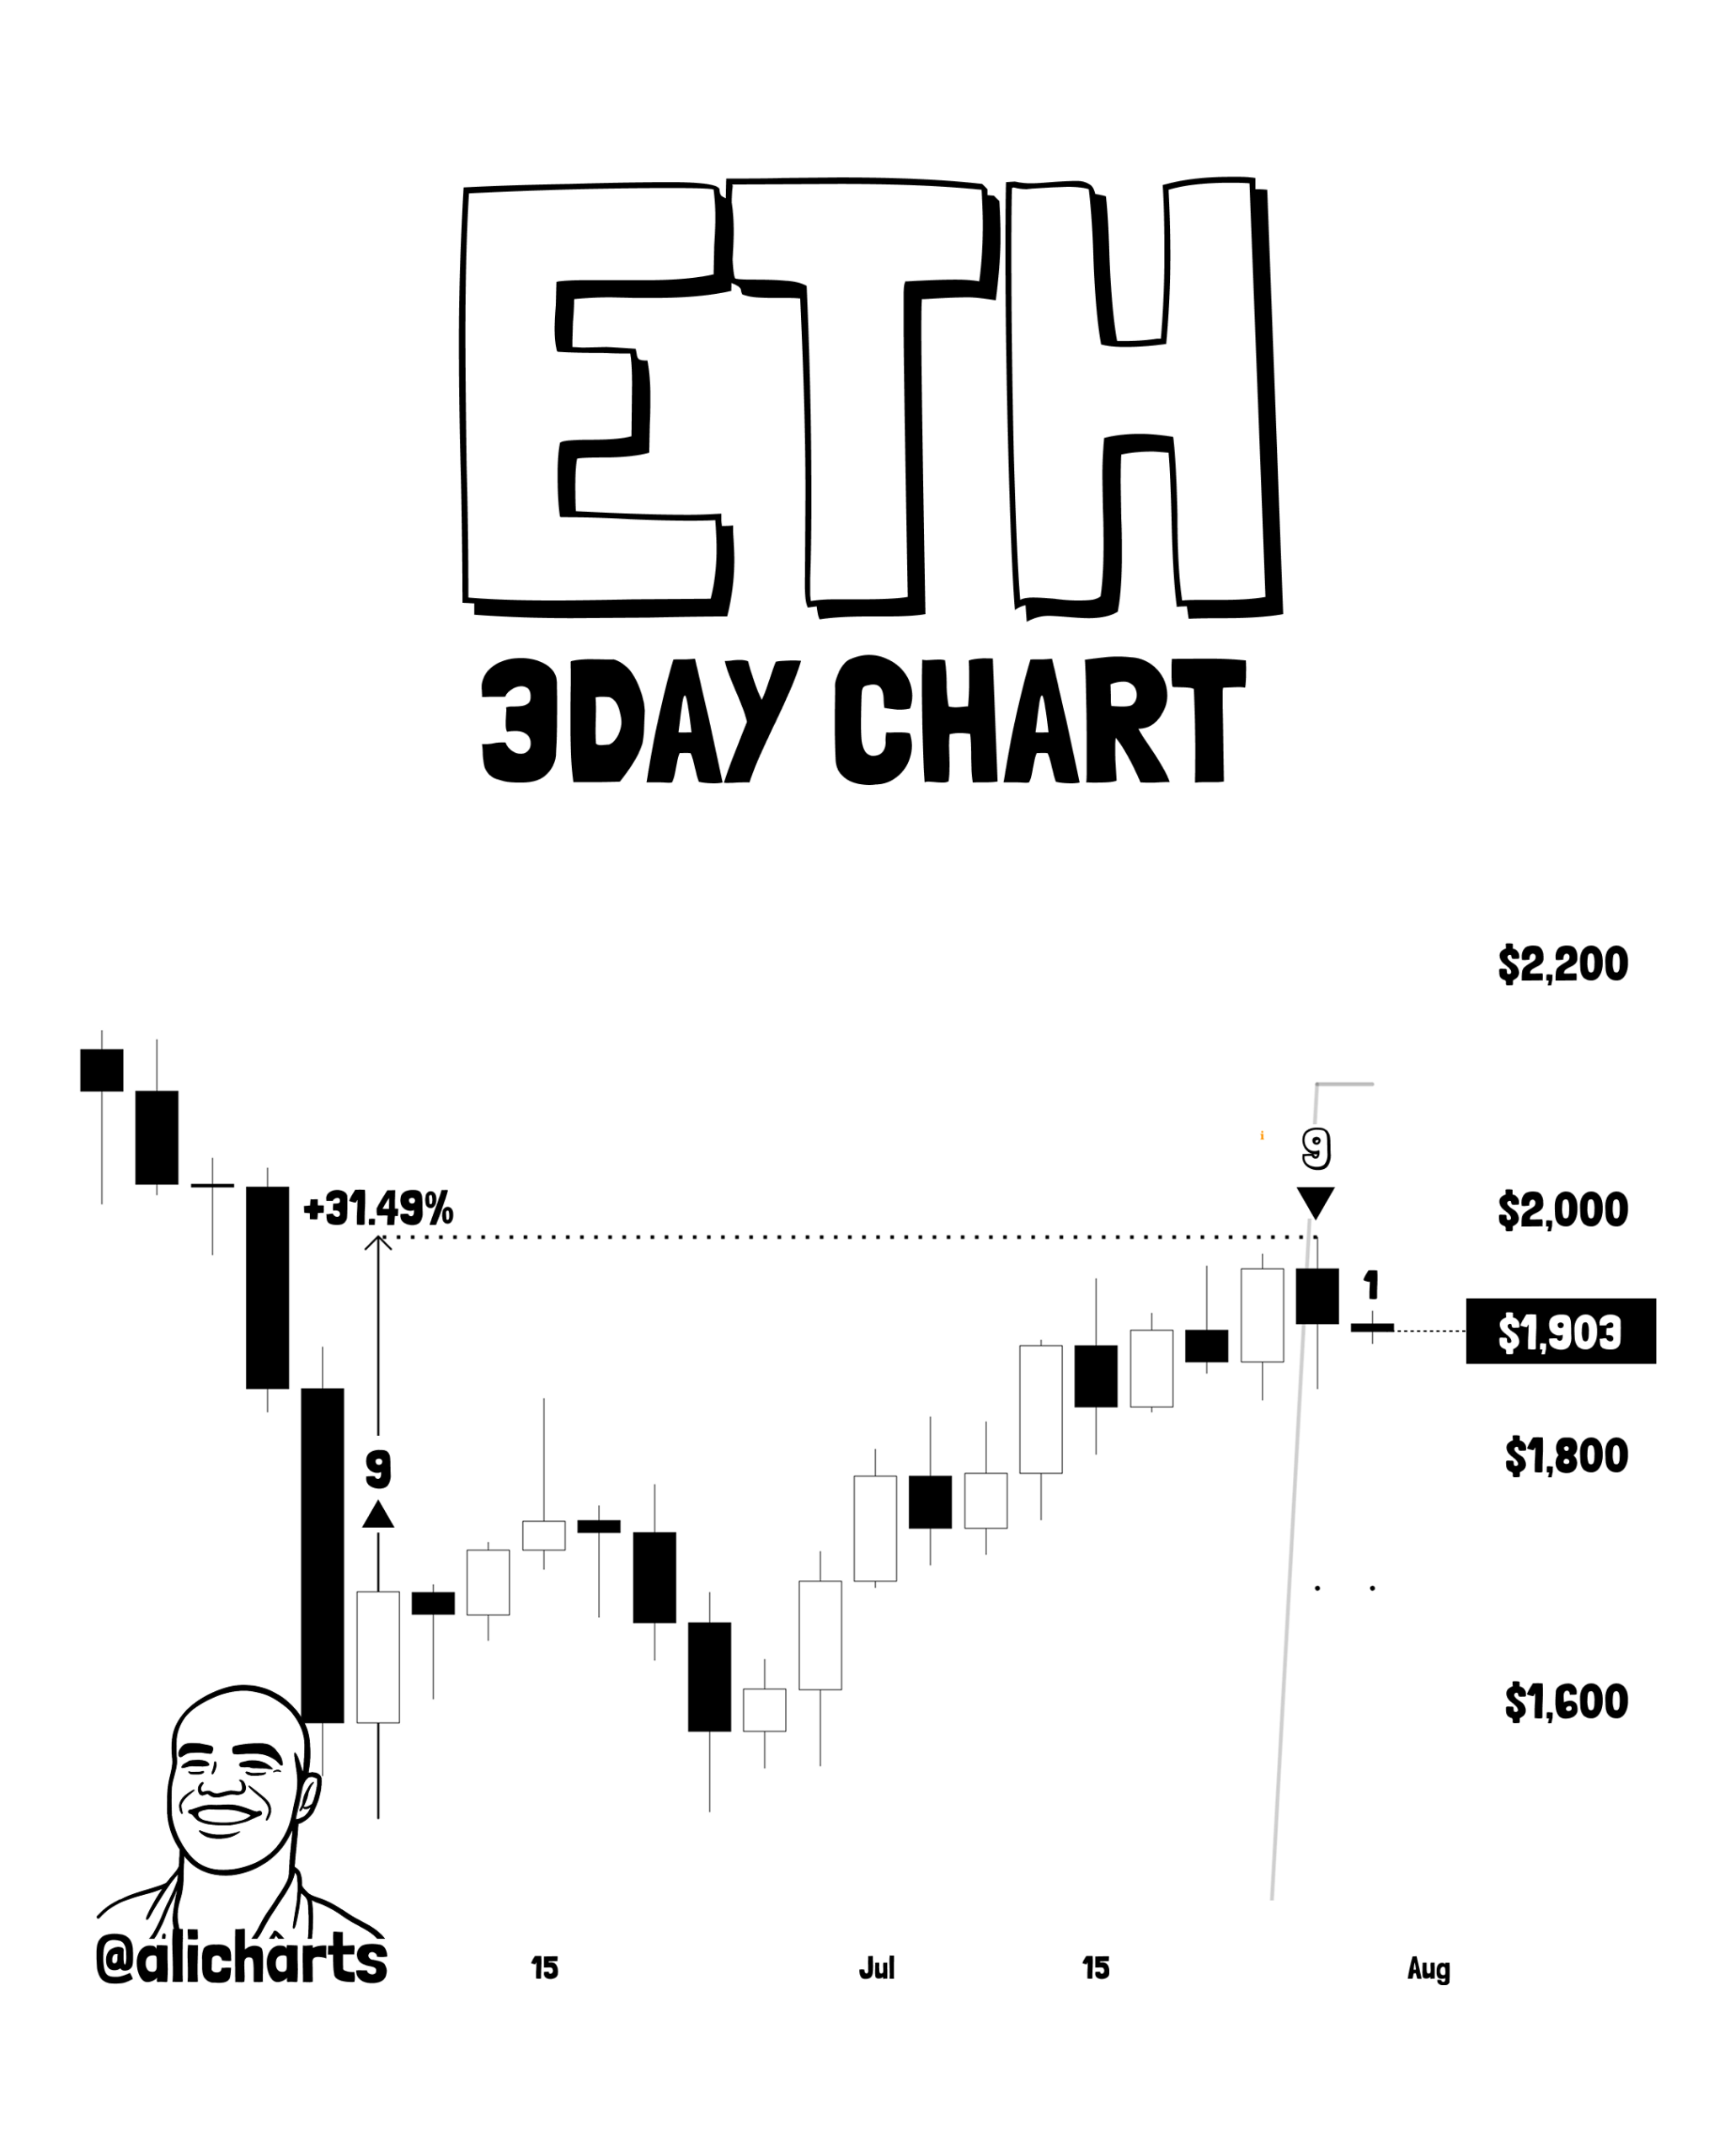
- The TD Sequential indicator flipped to a sell signal after calling Ethereum’s July rebound.
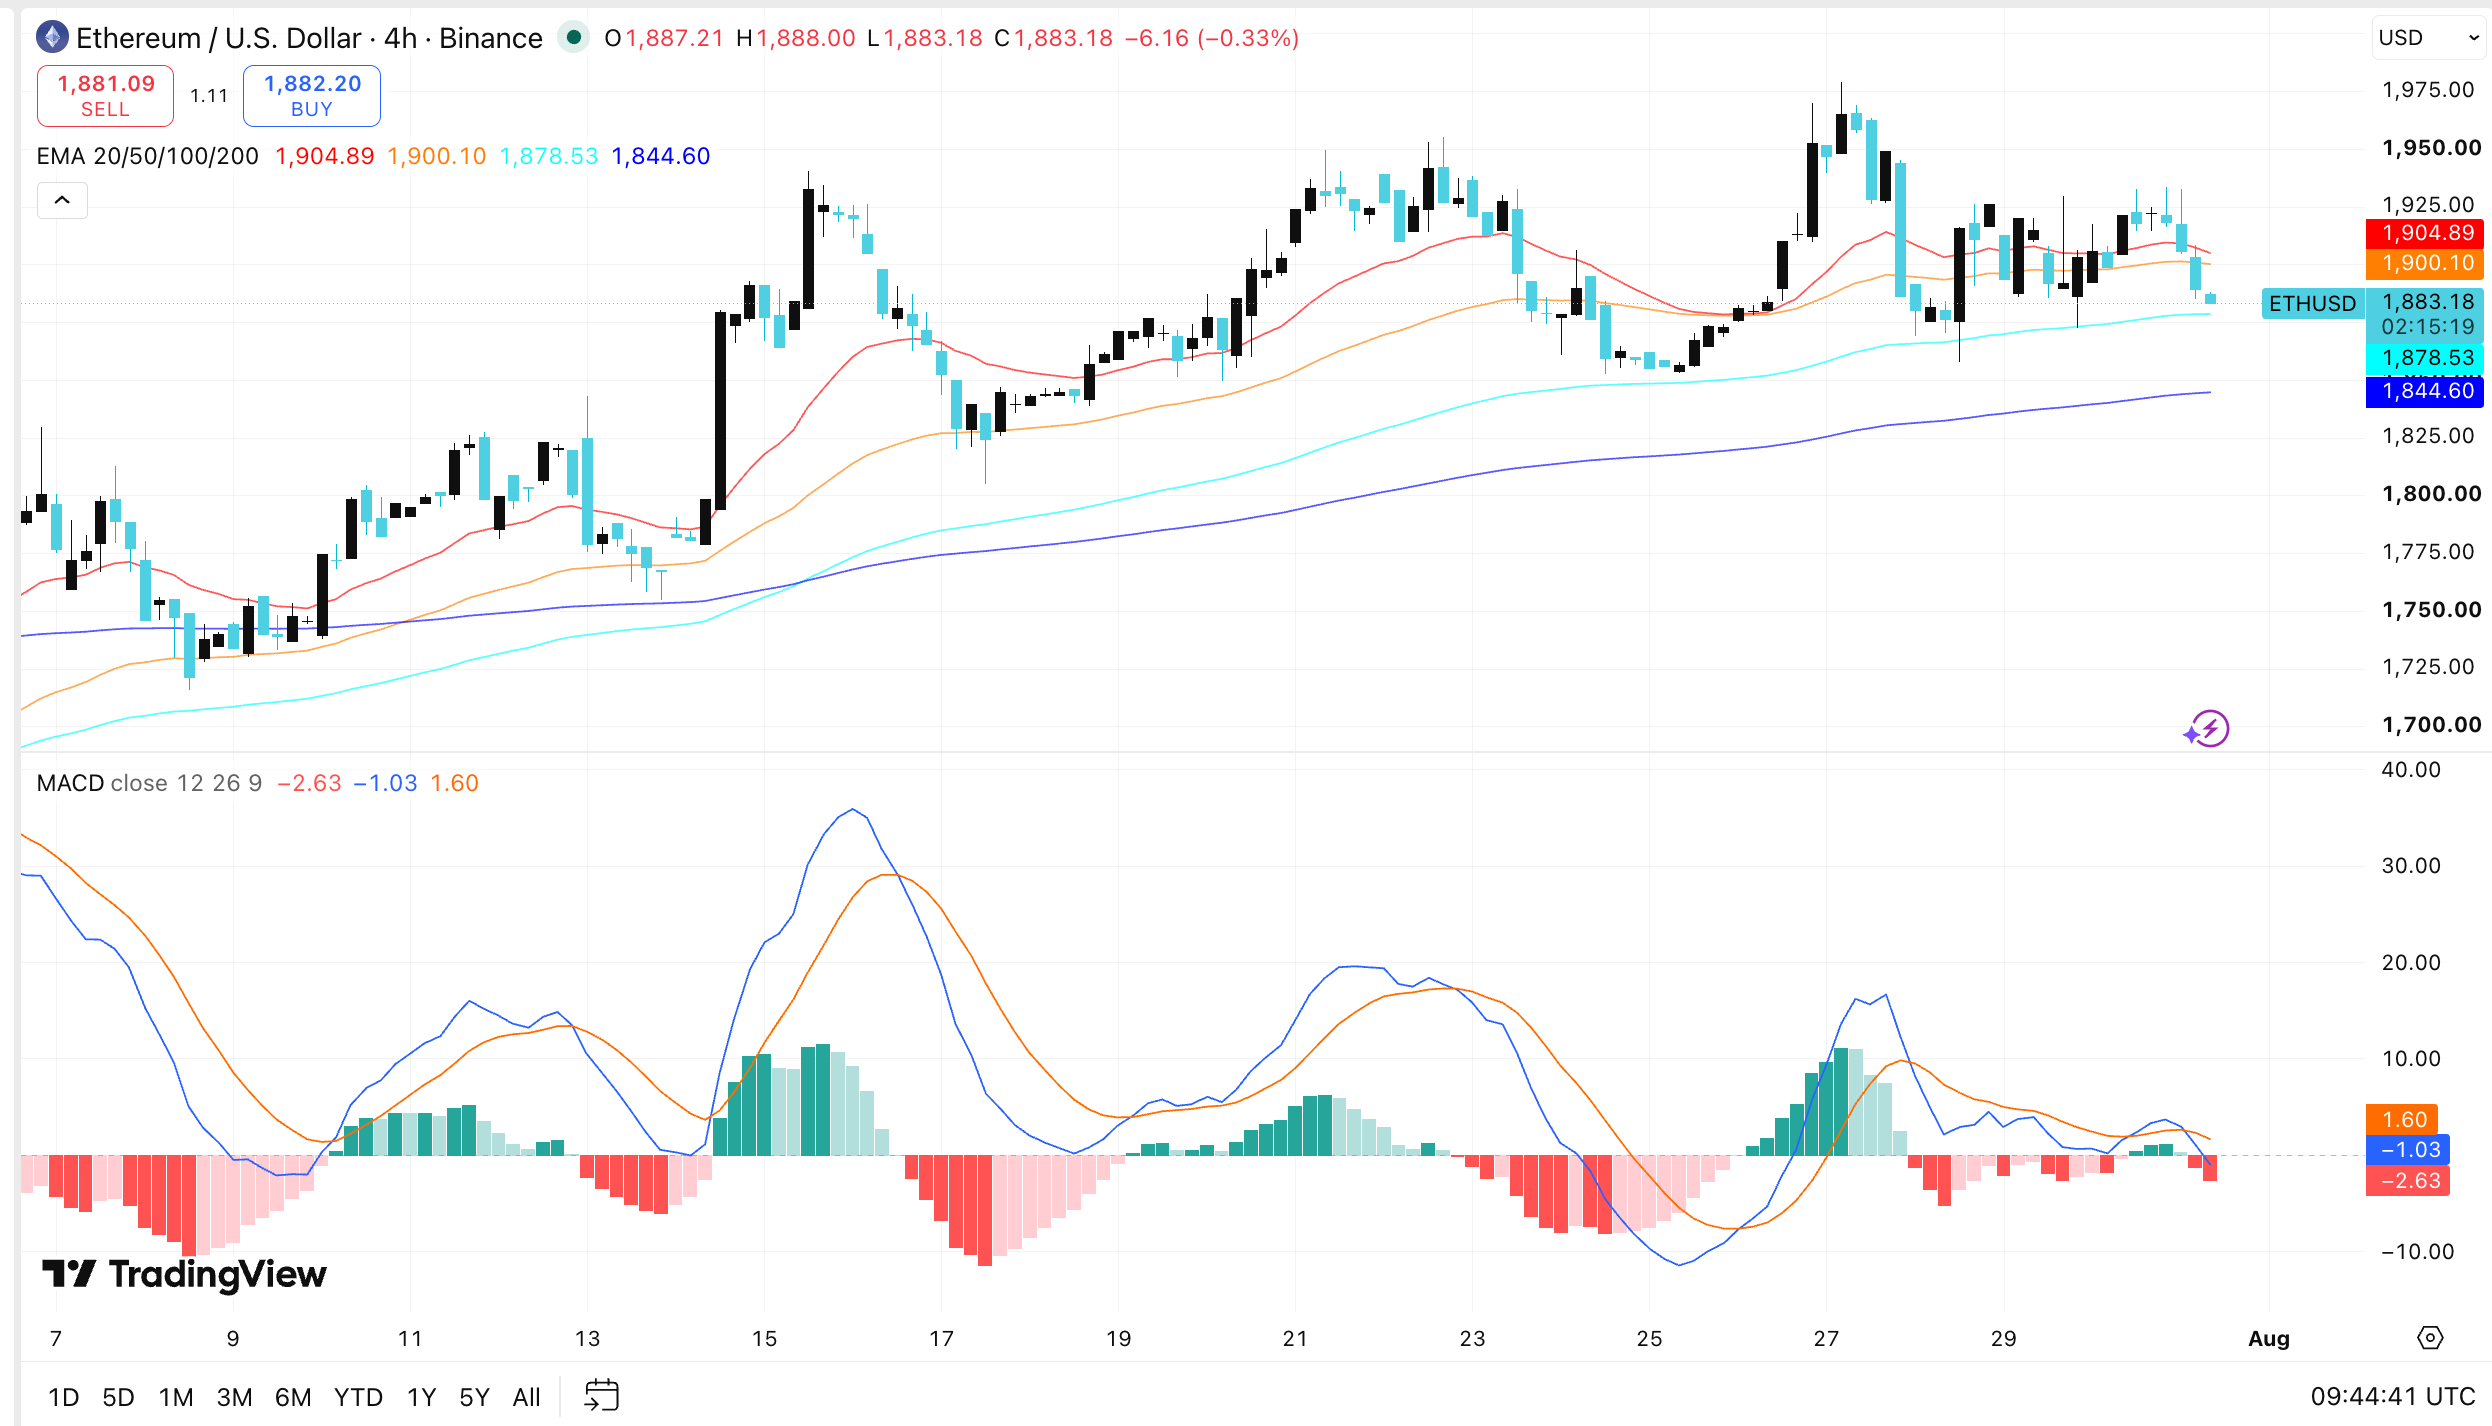
- Ethereum traded below the 20-period and 50-period EMAs on the four-hour chart.
- Support remained near $1,878, with the 200-period EMA around $1,844 as the next level.
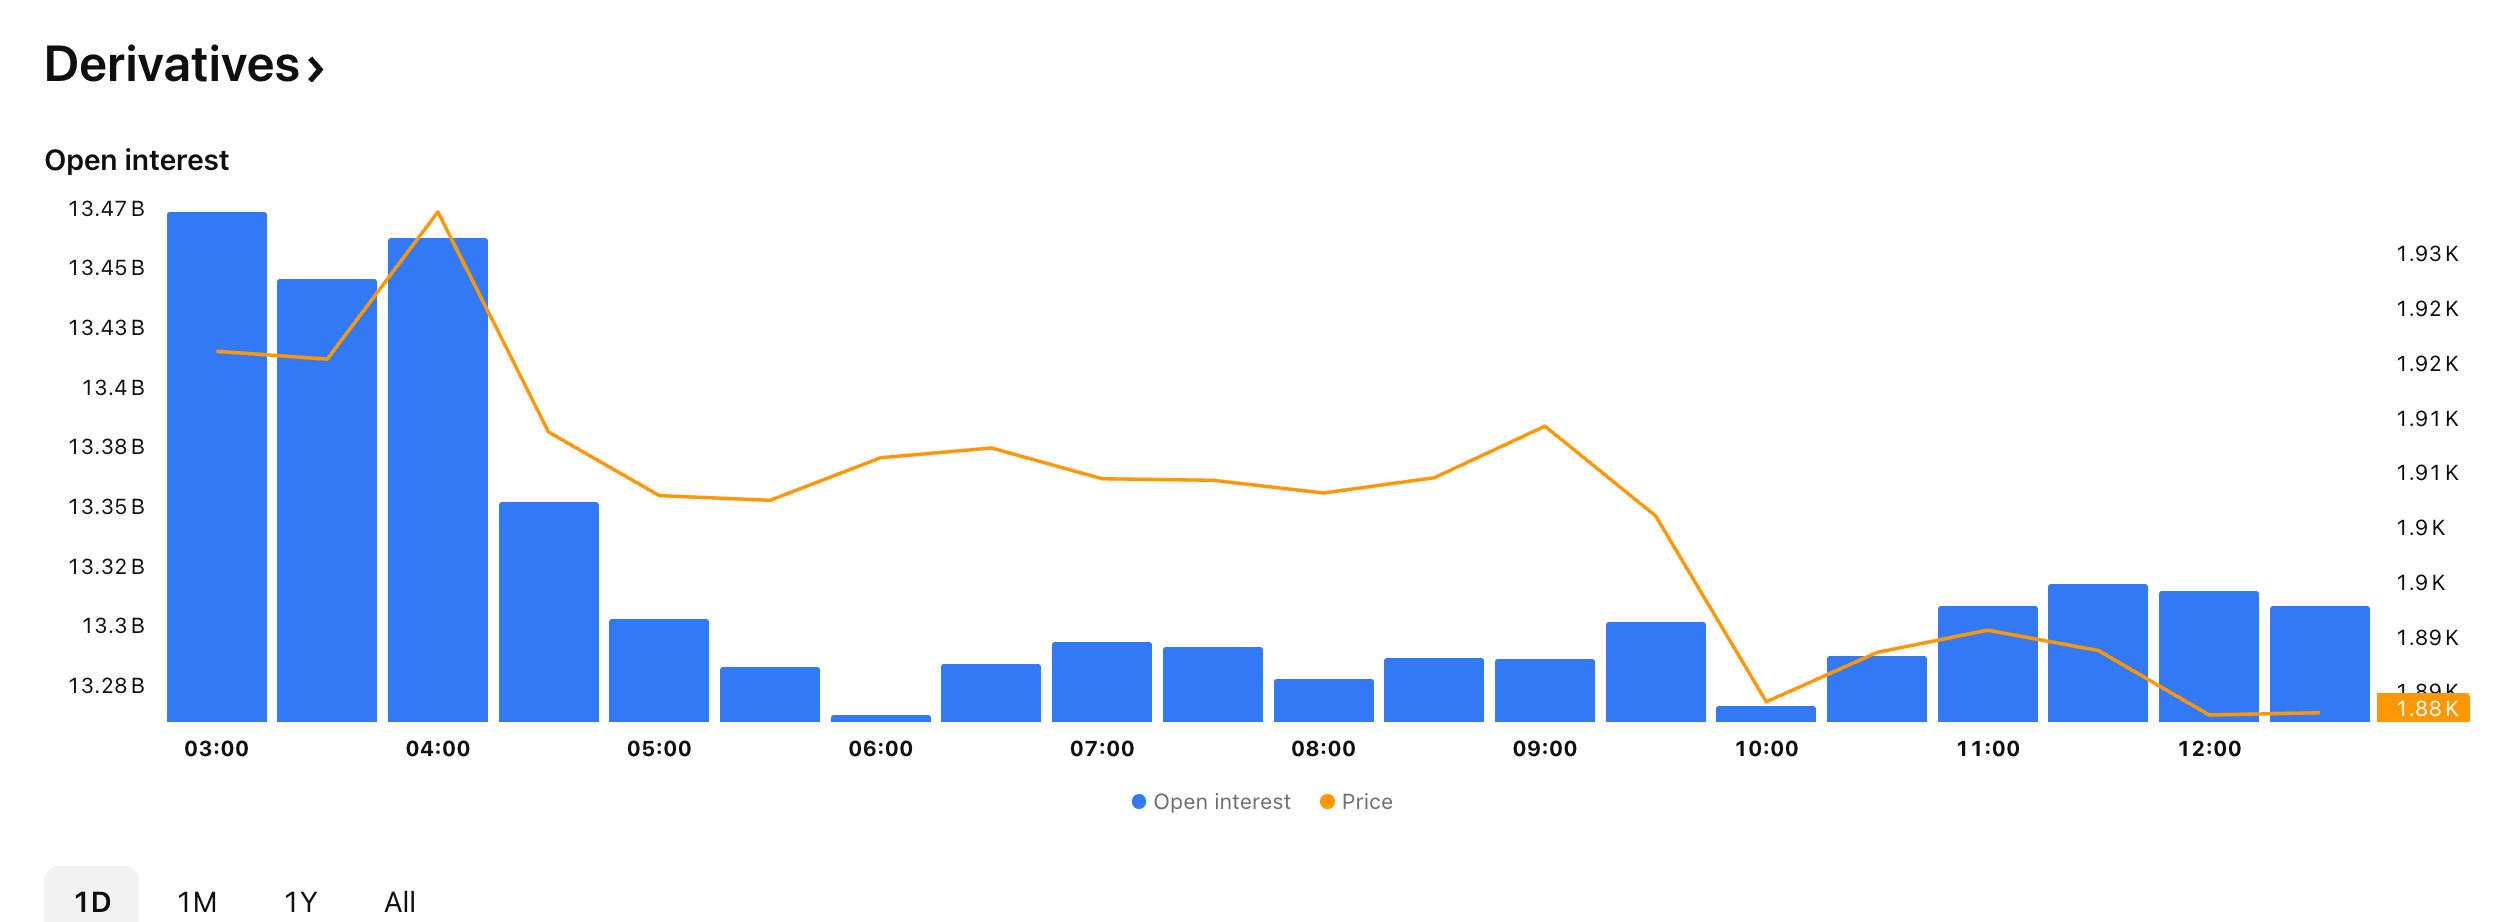
- Ethereum open interest fell from about $13.47 billion to nearly $13.31 billion.
Ethereum’s rebound is losing strength after the ETH price failed to break above the $2,000 level. The asset rose from about $1,520 in early July to nearly $1,980 last week. That move marked its highest level in several months.
The rally has slowed as traders watch a bearish signal from the TD Sequential indicator. The same tool flashed a buy signal near the July low before Ethereum recovered. It has shifted to a sell signal as ETH trades below key short-term levels.
TD Sequential Turns Bearish After ETH Rally
Market analyst Ali Martinez said the TD Sequential has tracked recent Ethereum reversals closely. The indicator showed a buy setup when ETH fell near $1,520. Ethereum then gained sharply and moved toward the $2,000 resistance zone.
Source: X
Martinez said the indicator has now produced a sell signal. The signal suggests that the recent upward move may be losing momentum. Ethereum has failed to hold above $1,900, which has kept buyers under pressure.
ETH Price Holds Near Immediate Support
The ETH price traded near $1,883 on the four-hour chart after falling below its 20-period and 50-period exponential moving averages. The 20-period EMA stood near $1,904.89, while the 50-period EMA was close to $1,900.10.

Ethereum remained slightly above the 100-period EMA at $1,878.53. This level now acts as support. A break below it could open the way toward the 200-period EMA near $1,844.60.
Source: TradingView
The MACD showed weaker momentum. The MACD line stayed below the signal line, while the histogram moved deeper into negative territory. Buyers need to reclaim the $1,900 to $1,905 range to improve the short-term structure.
Analysts Warn of Another Rejection
Crypto Lens said Ethereum has remained between $1,860 and $1,955 as selling pressure limits the recovery. The analyst expects ETH price to test $2,000 before another decline begins. The projected downside range sits between $1,400 and $900.
ETHEREUM stuck at $1860-$1955 range for a reason.
The real $ETH Bull Trap is just getting started.
ETH will first rally into the $1,900–$2,000 resistance zone.
Then the real capitulation begins.
My roadmap:
1. Rally to 1,900–2,000
2. 7–10 days of distribution
3. Final bottom… pic.twitter.com/4hreCqO5YO— Crypto Lens (@crypto_lens_) July 28, 2026
Crypto Rover focused on the ETH/BTC pair. Ethereum has formed lower highs and lower lows against Bitcoin during the past year. The pair recovered from about 0.025 in June to 0.03, but it still trades below previous peaks.
Rover expects another rejection that could push the pair below 0.0235. That move would place Ethereum at a fresh multi-year low against Bitcoin and show continued weakness relative to the market leader.
I’m sorry, bulls.$ETH vs $BTC keeps forming lower highs, and the latest rally is already losing momentum.
The same thing happened last time before ETH/BTC fell to a new low. pic.twitter.com/Si09I1gfIN
— Crypto Rover (@cryptorover) July 30, 2026
Open Interest Falls as Liquidations Rise
Ethereum open interest fell from about $13.47 billion to nearly $13.31 billion during the past day. The decline showed that traders reduced leveraged positions as ETH moved toward $1,880. Open interest later recovered slightly, but activity remained cautious.
Source: TradingView
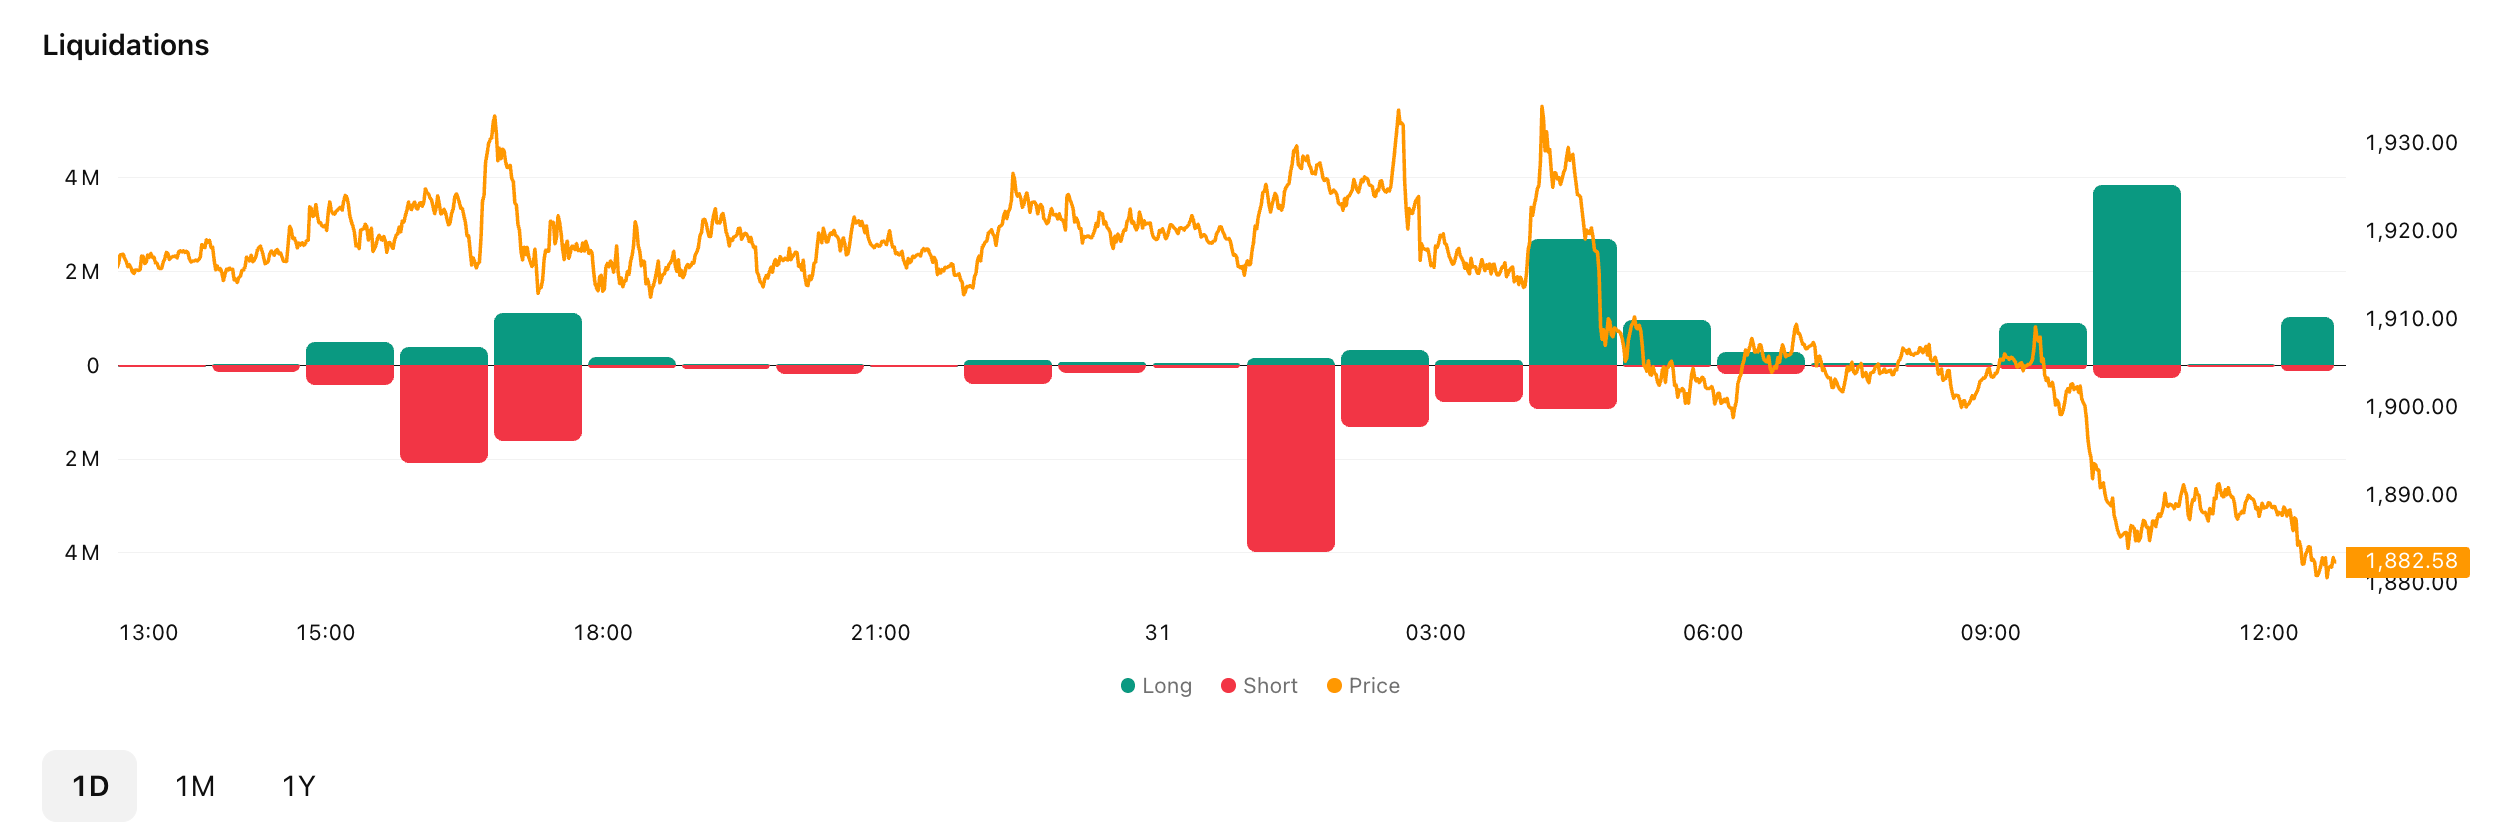
Liquidation data showed losses on both sides of the market. Long liquidations reached about $3.8 million during the price decline. Short liquidations also rose during brief rebounds, with one cluster near $4 million.
Source: TradingView
The data shows that Ethereum remains in a fragile range. Support near $1,878 and resistance above $1,900 now shape the next move. A break from either level could guide the ETH price direction in the coming sessions.





Be the first to comment