



Ethereum (ETH) remains in a bullish structure as buyers defend the recent breakout and continue testing resistance. Market momentum remains constructive, while derivatives positioning stays resilient despite softer trading activity. Ethereum’s strength in real-world asset adoption further supports its broader market outlook.
Ethereum Maintains Bullish Market Structure
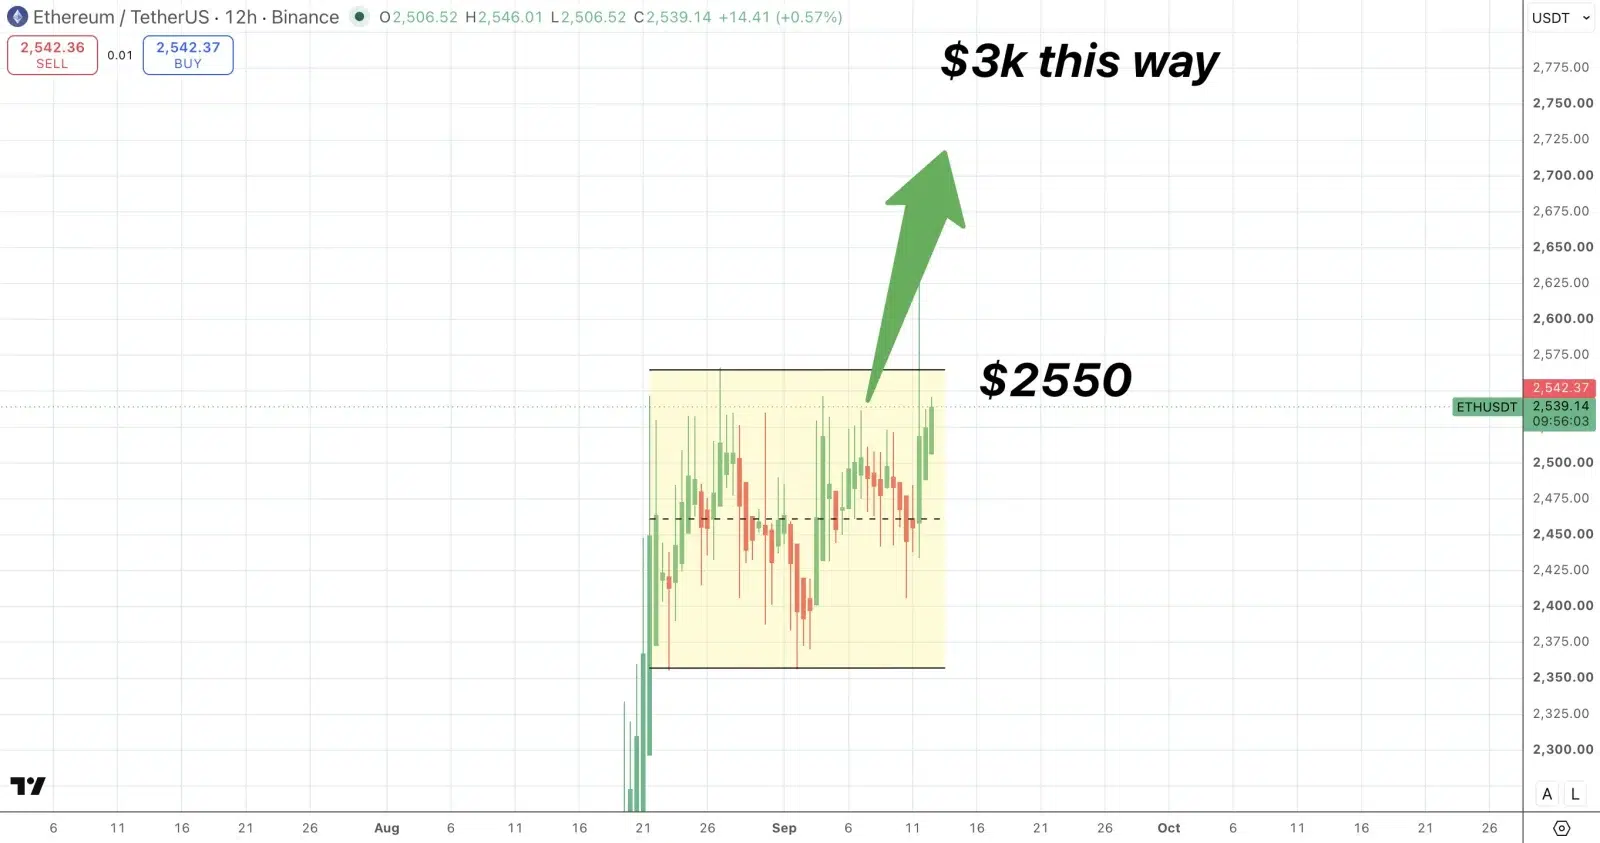
Ethereum (ETH) continues to show a bullish technical structure as buyers attempt to push the cryptocurrency above a key consolidation zone near $2,550. Crypto analyst Satoshi Flipper highlighted the resistance level, suggesting that a successful breakout could put the $3,000 mark into focus.
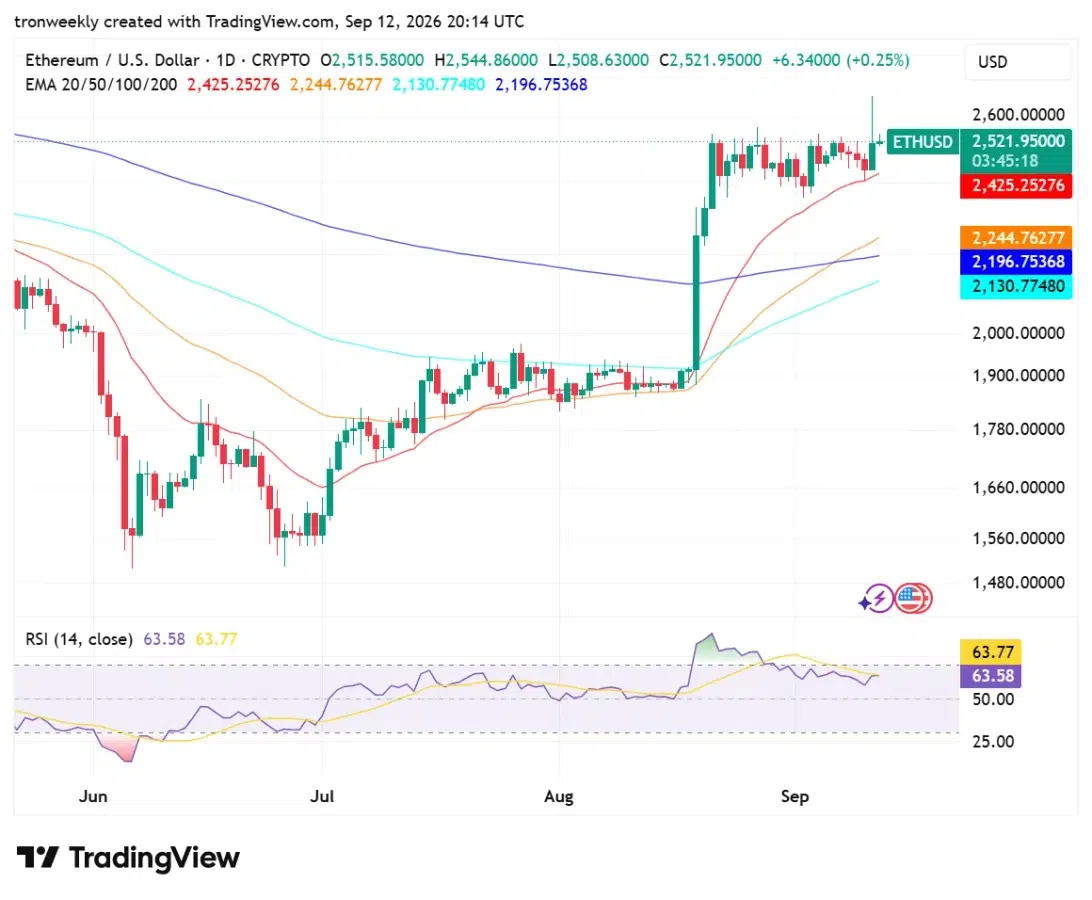
Ethereum strengthened considerably after breaking out of a mid-summer consolidation range around $1,560. The advance pushed ETH to approximately $2,521.95 and established a stronger market structure above its major moving averages.
Source: Satoshi Flipper’s X Post

The 20-day EMA stands at around $2,425.25. It is likely that the cryptocurrency would manage to trade above this level and thereby support the overall bullish trend along with giving a technical foundation to the buyers for further upward action.
Also Read: Ethereum Eyes $15K Breakout as BlackRock Accumulation Accelerates
$2,550 Resistance Level Becomes Key for Ethereum
Ethereum has now consolidated below the resistance zone of $2,550, thus making this particular level an essential one for the digital currency. Any breach above resistance is likely to confirm fresh buying interest and will help push prices to $3,000.
However, confirmation of the breakout is yet to come. A temporary rise above resistance accompanied by rejection can see sideways movement prevail again. The traders will thus look out for whether or not there is sustained support above the breakout area.
However, it is worth noting that the zone of $2,425 is still significant. Staying above the 20-day EMA would maintain the existing bullish setup, but a breach might bring Ethereum closer to $2,200.
RSI Signals Strong but Controlled Momentum
According to the TradingView chart analysis, technical indicators of Ethereum still confirm a bullish scenario. In particular, the RSI indicator over a 14-period period equals 63.58, showing healthy buying pressure and not reaching overbought levels.
Source: TradingView
The existing RSI indicates that there is still room for growth in ETH as long as the buyers are coming back with more force. The sustained position above 50 will support the momentum bullishness perspective.
While that is happening, traders should also look out for any signs of exhaustion in the market as Ethereum gets closer to its resistance level. A declining RSI alongside an unsuccessful breakout will indicate that the market is about to consolidate again.
Trading Activity Weakens as Volume Declines
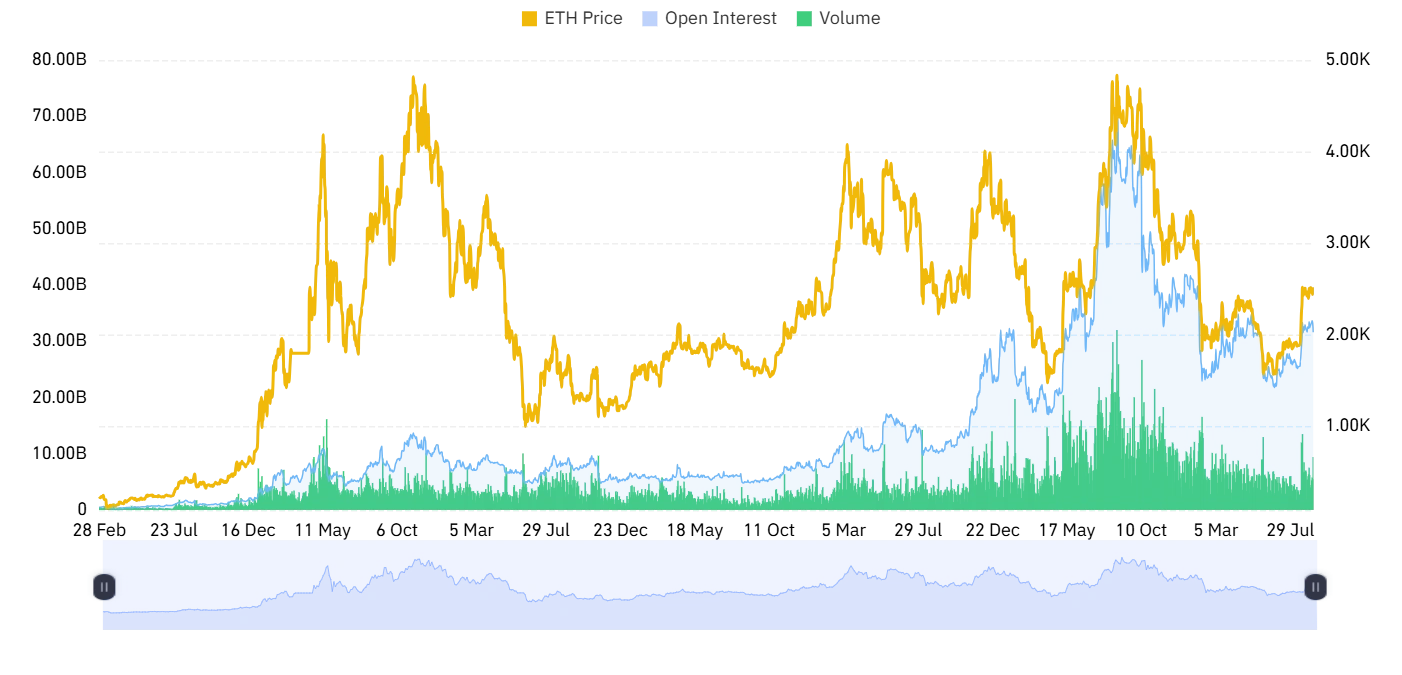
However, the data from the derivatives looks much more conservative. As per Coinglass figures, the daily trading volume of Ethereum dropped by 66.76%, reaching nearly $23.22 billion.
Source: Coinglass
Despite the contraction in volume, open interest is fairly constant, holding steady at roughly $31.80 billion. Such a difference indicates that derivatives positions have been maintained while market activity has dropped off.
This might mean that traders are waiting to see a clear direction before taking action. Thus, a breakout over $2,550, along with increased volume, would offer more concrete evidence of the next upward phase for Ethereum.
Ethereum Dominates Real-World Asset Market
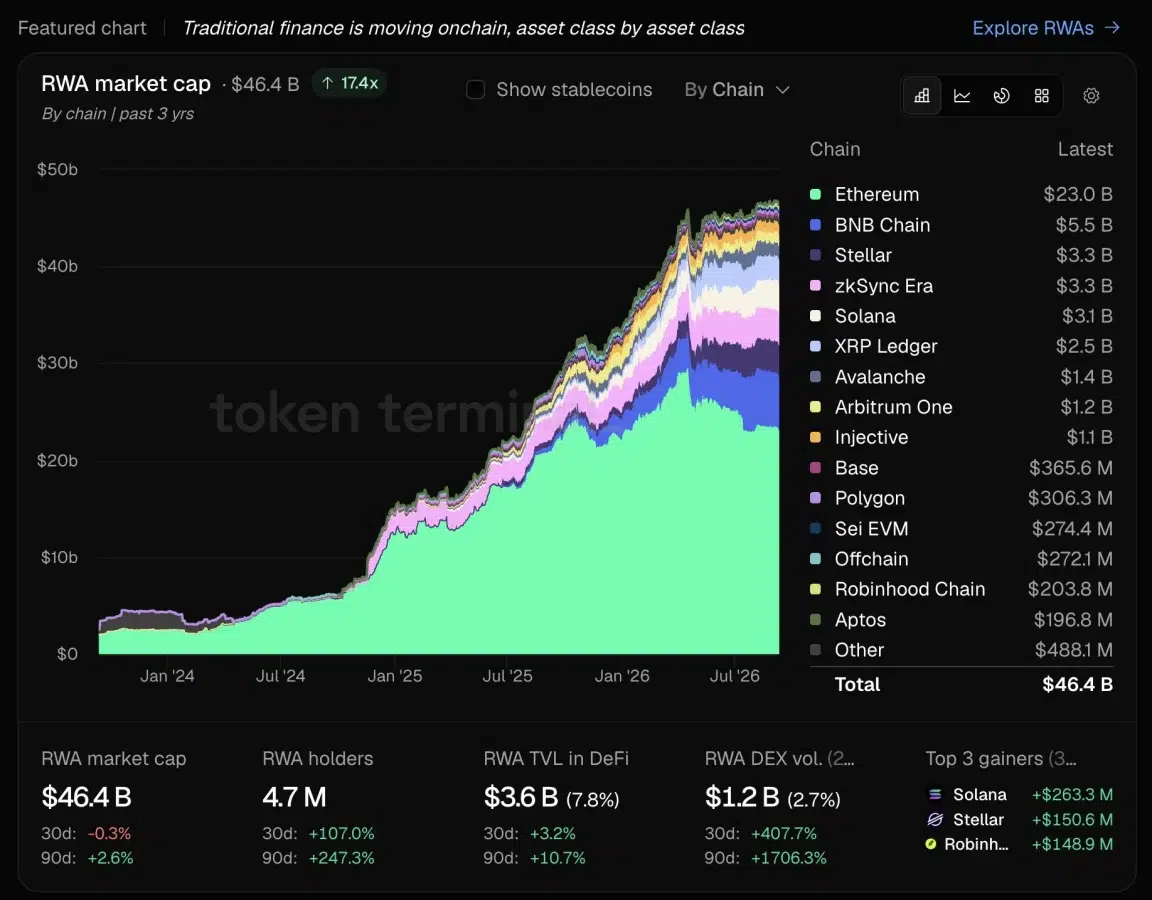
The fundamental characteristics of the Ethereum network overall are still quite significant since the real-world assets continue growing on blockchain networks. According to Token Terminal, Ethereum is dominating the RWA market with roughly $23.0 billion in market capitalization and taking 49.6% of the whole $46.4 billion market.
Source: Token Terminal’s X Post
However, some other chains have shown a considerable increase in terms of market capitalization. Specifically, Solana’s RWA market cap increased by about $263.3 million, while Stellar and Robinhood Chain grew by $150.6 million and $148.9 million, respectively.
Even though RWA’s expansion does not assure any increase in the ETH token price in the short term, Ethereum’s dominance in the market is evident from its performance in this area.
For now, traders will be watching the resistance of $2,550. Any breakout will make the bullish structure stronger and could see a target of $3,000, but a failure could push ETH towards its important moving average support.
Also Read: Ethereum Glamsterdam Upgrade Faces Key Test Before Oct. 6
This article contains market analysis and price predictions. These are not guarantees. Crypto markets are volatile. Always DYOR. Not financial advice.



Be the first to comment