



Ethereum price has slipped into a bearish rounded top structure as institutional outflows, leveraged shorts, and weakening momentum pressure the token below $2,150.
Summary
- Ethereum price has formed a bearish rounded top pattern after failing repeatedly near $2,400, with analysts warning of a possible drop toward $1,900.
- U.S. spot Ethereum ETFs recorded nine straight sessions of outflows, with roughly 114,871 ETH worth $244.79 million exiting funds in one week.
- A trader opened a $100 million leveraged ETH short position as liquidation heatmaps showed heavy resistance clustered around the $2,150 level.
According to data from crypto.news, Ethereum (ETH) price was trading near $2,115 at press time after falling nearly 12% over the past seven days. The token briefly rebounded from the psychological $2,000 support zone as traders continued rotating capital into Bitcoin while risk appetite across altcoins weakened.

Part of the recent selling pressure emerged immediately after the U.S. Senate Banking Committee advanced the CLARITY Act on May 19. Instead of fueling a sustained rally, the regulatory breakthrough triggered a major sell-the-news reaction across Ethereum markets as traders locked in profits following weeks of speculative positioning ahead of the vote.
Institutional sentiment deteriorated further after JPMorgan published a bearish report warning that Ethereum’s future upgrades, including Glamsterdam and Hegotá, could continue weakening the network’s fee-burning mechanism.
Analysts at the bank argued that falling Layer-2 transaction costs were reducing ETH burn activity enough to keep the asset structurally inflationary rather than deflationary, a thesis that damaged confidence among large investors.
At the same time, spot Ethereum ETFs in the United States recorded their tenth consecutive trading session of net outflows on Friday. Data compiled by SoSoValue shows that over the past week, roughly $215 million exited the funds. The persistent selling streak removed a major source of buy-side liquidity just as Bitcoin continued attracting institutional inflows.
On-chain data also signaled weakening conviction among large holders. Whale addresses holding significant ETH balances reportedly dropped from around 1,100 to nearly 1,030 during the correction period.
Meanwhile, the ETH/BTC ratio slid toward 0.027, its lowest level this year, highlighting Ethereum’s underperformance relative to Bitcoin as investors increasingly favored the safer large-cap asset.
Outside crypto markets, easing tensions between the United States and Iran briefly improved sentiment across risk assets after both sides reportedly discussed a temporary ceasefire framework and partial reopening of the Strait of Hormuz.
Oil prices retreated 5$ to $91 on Monday following the headlines, reducing immediate inflation concerns and helping Ethereum stabilize above $2,000 after several sessions of aggressive liquidation-driven selling.
Is Ethereum forming a major bearish reversal pattern?
On the daily chart, Ethereum has formed what appears to be a bearish rounded top pattern stretching from mid-April into late May. The structure developed after ETH failed multiple times to sustain momentum above the $2,400 region, gradually transitioning from higher highs into a curved distribution pattern before breaking lower.
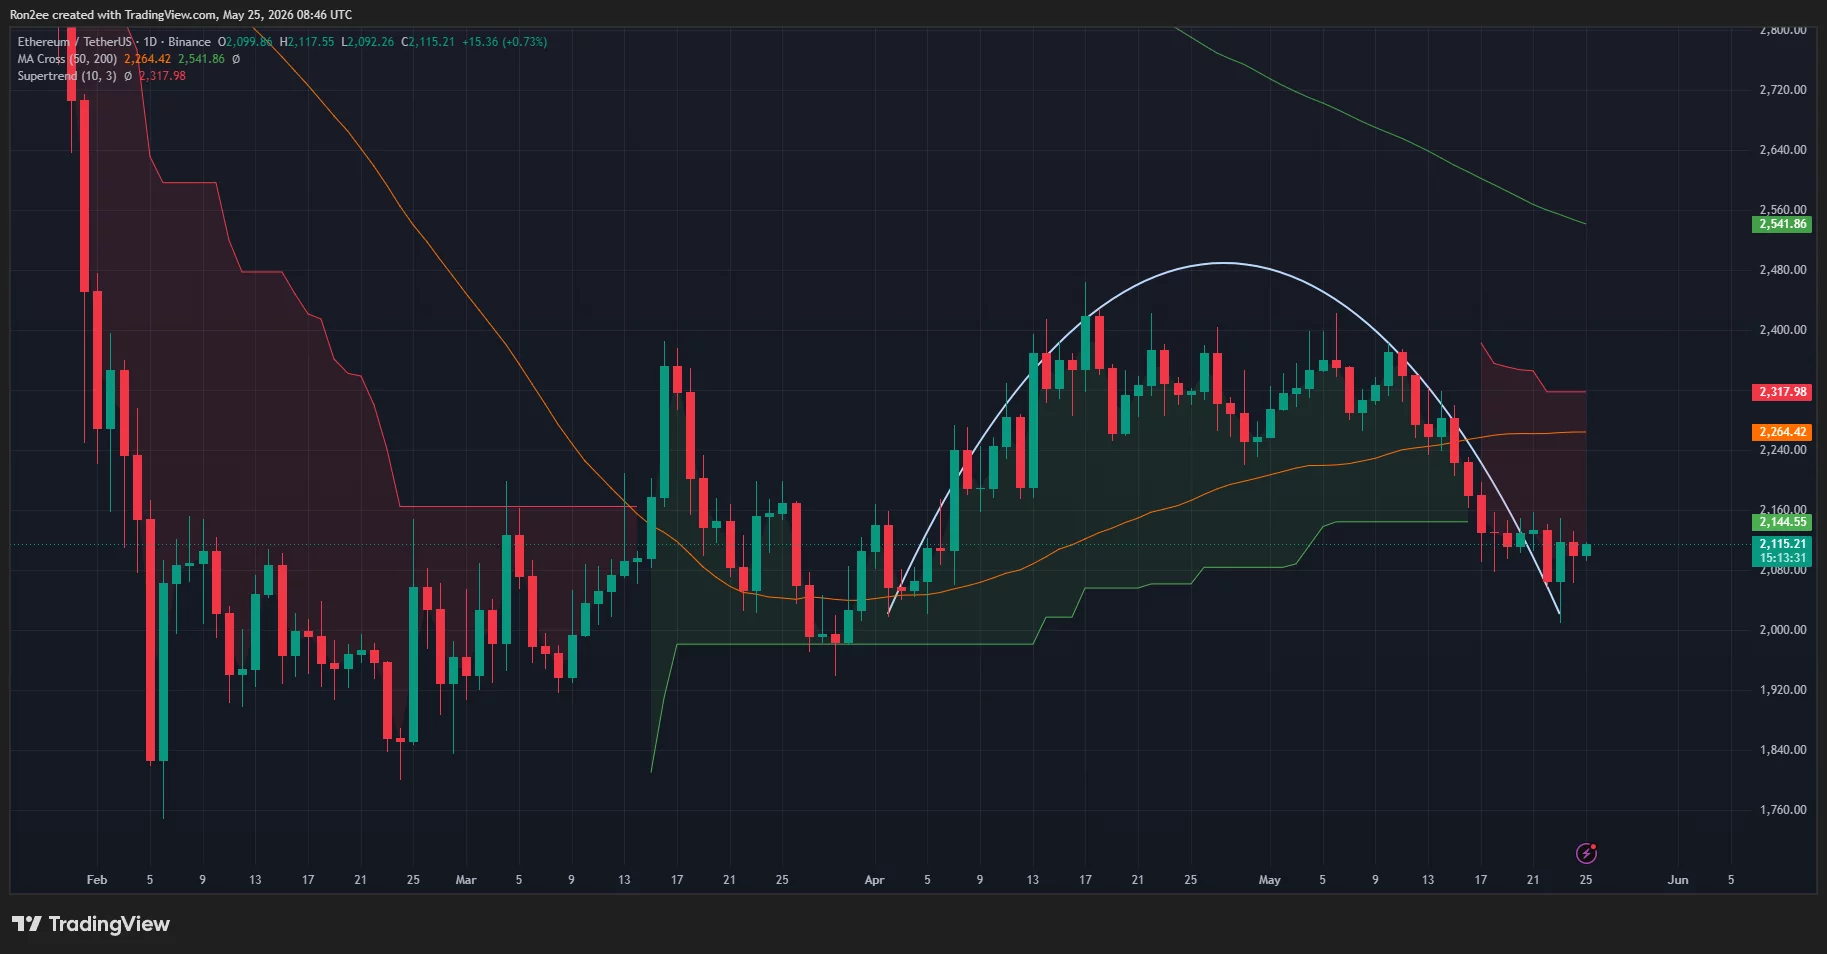
The rounded top neckline around $2,150 has now flipped into immediate resistance. Ethereum attempted to reclaim that level during the latest rebound but sellers quickly rejected the move, reinforcing bearish control over short-term price action.
Technical indicators continue leaning negative. Ethereum remains below the Supertrend resistance near $2,318 while also trading under the 50-day moving average around $2,264. The longer-term 200-day moving average near $2,541 continues sloping downward, showing that the broader trend remains weak despite temporary relief rallies.
A breakdown projection from the rounded top pattern points toward a possible move into the $1,850–$1,900 range if sellers regain momentum. That target aligns with the lower support zone visible on the chart from February’s consolidation period.
Meanwhile, liquidation data from CoinGlass shows heavy leverage concentration between $2,150 and $2,170, creating a major liquidity barrier directly above current price levels. Bright liquidation clusters in that region suggest many short positions could be forced out if ETH successfully reclaims resistance, potentially triggering a short squeeze toward $2,250.
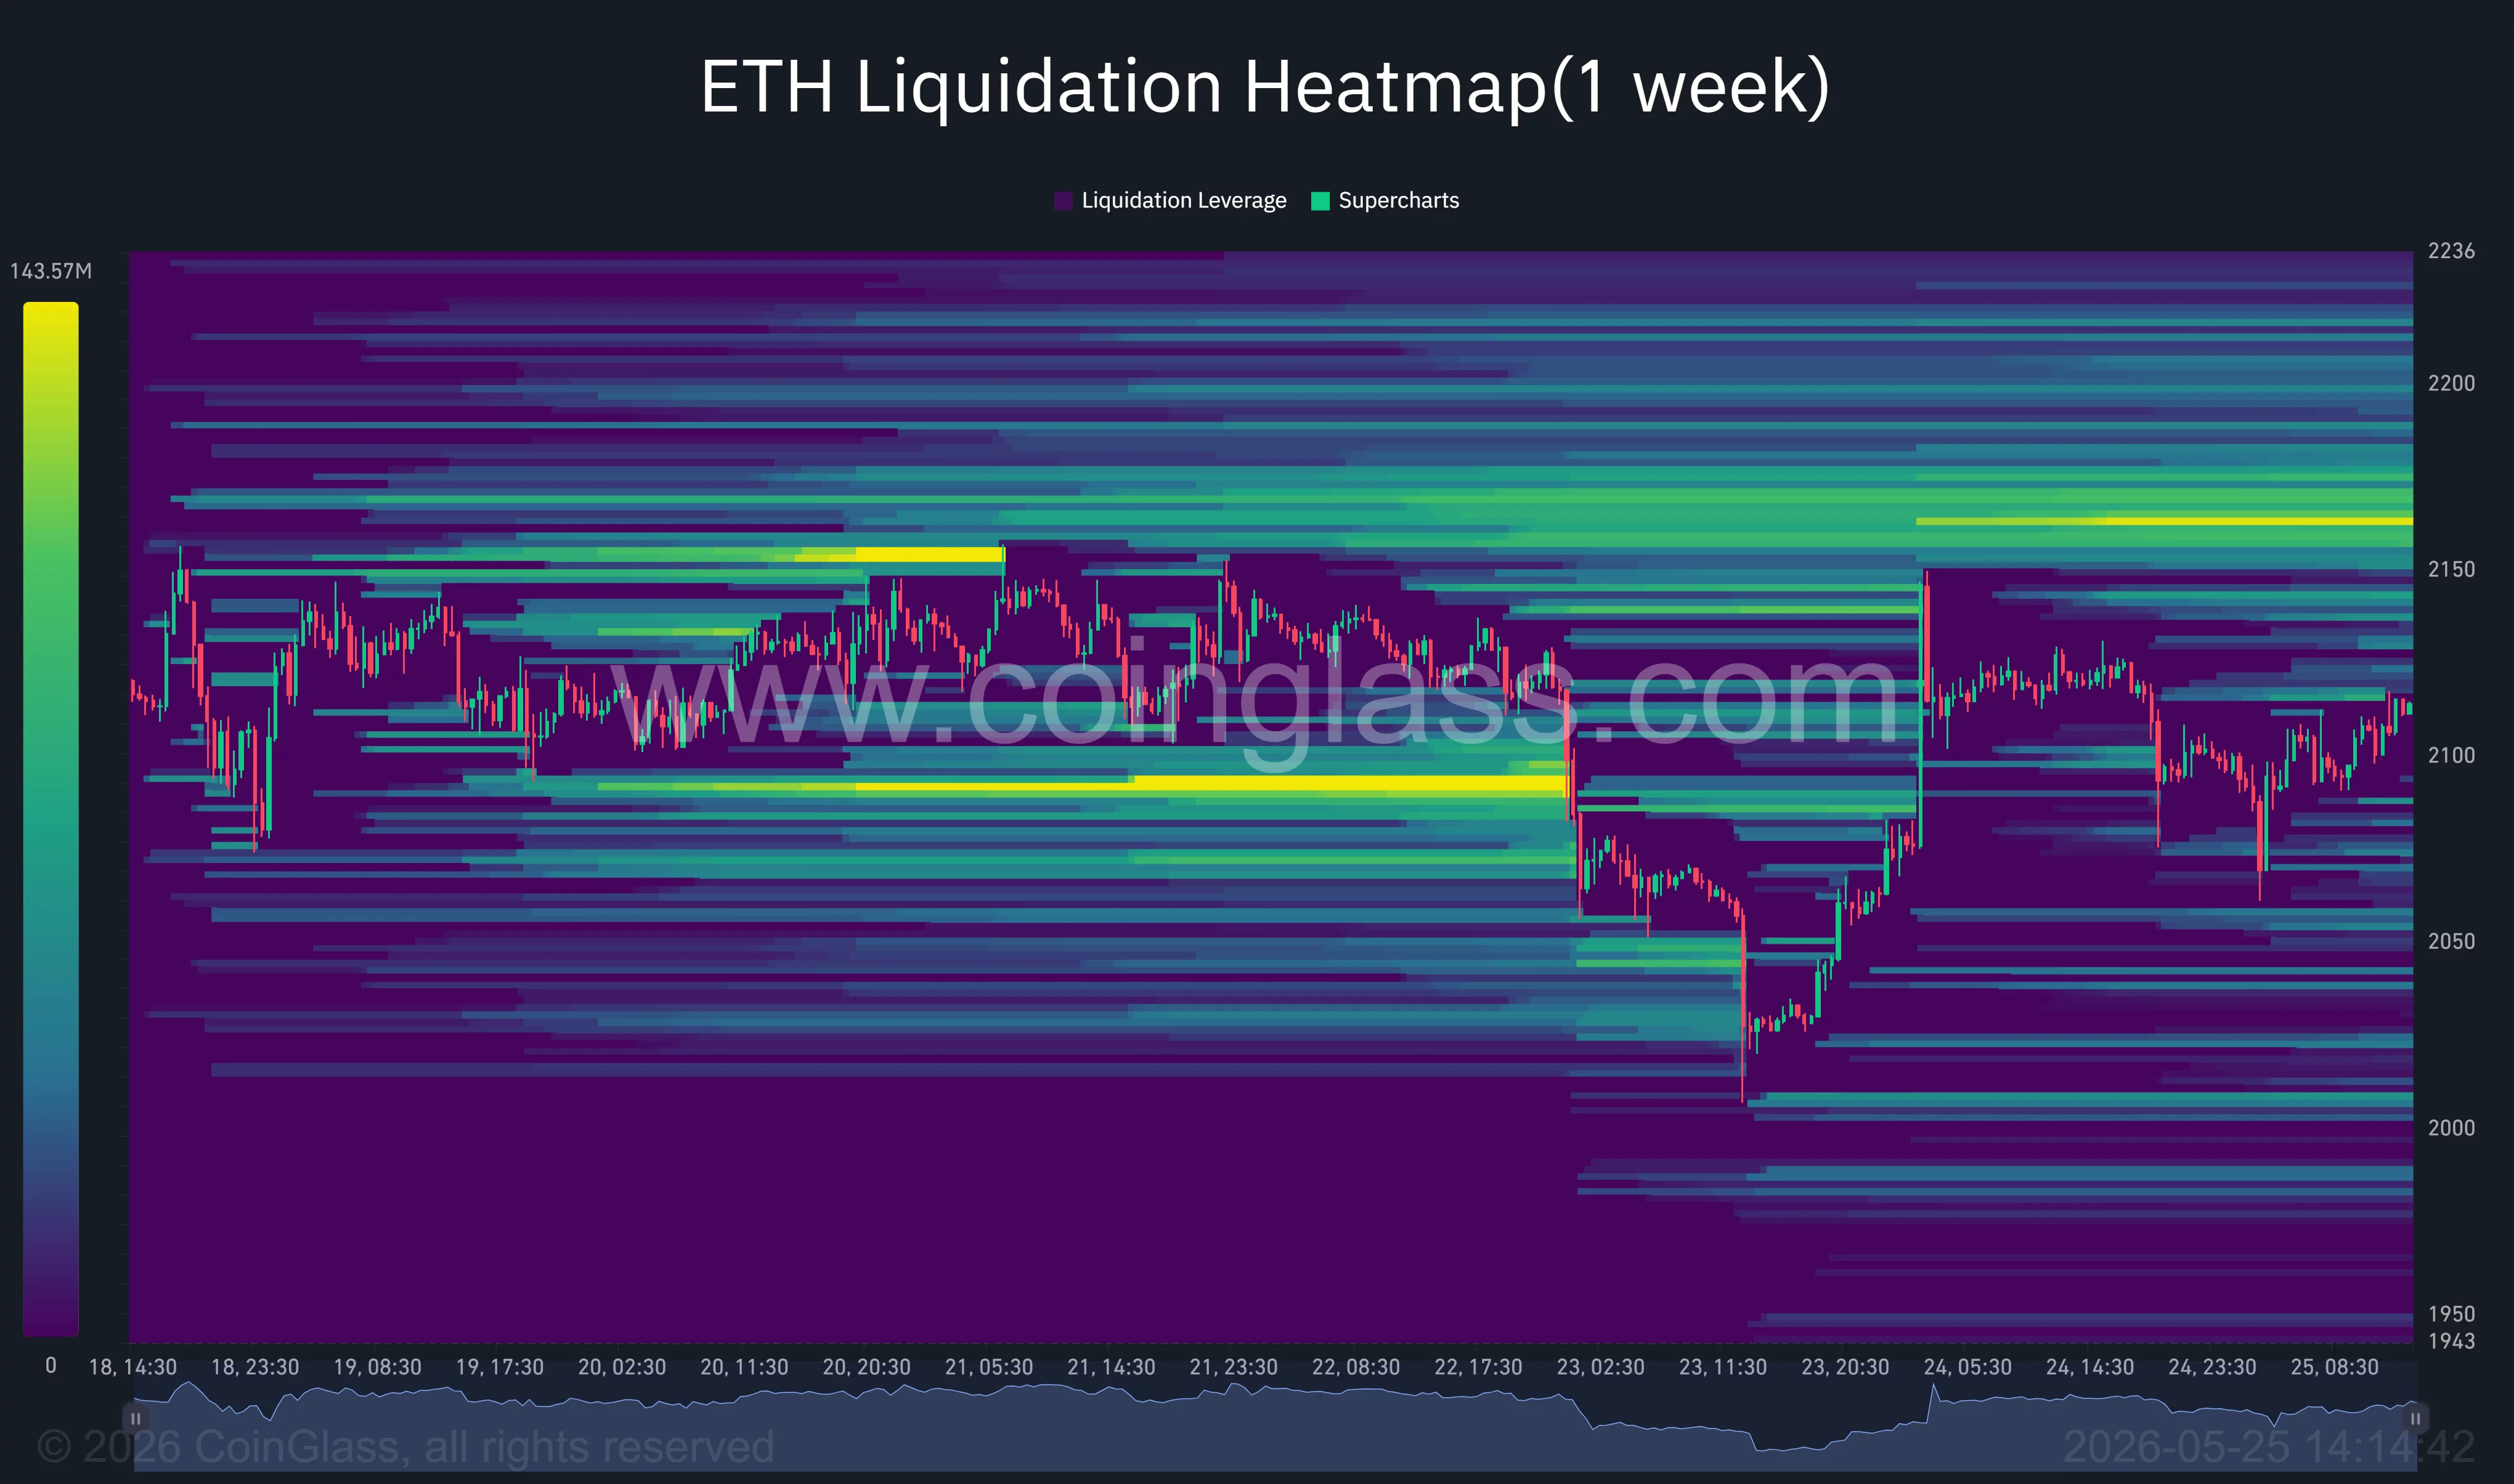
Still, downside liquidity remains substantial below $2,050 and near the $2,000 psychological level. A decisive breakdown beneath those zones could accelerate long liquidations and intensify volatility across perpetual futures markets.
Blockchain tracking platform Lookonchain revealed that a trader recently opened a massive 23x leveraged Ethereum short position worth more than $100 million. According to the post, the position involved roughly 47,600 ETH with a liquidation price near $2,149, placing the trade directly around Ethereum’s current resistance cluster.
Analyst Ted Pillows also warned that Ethereum remains trapped below a critical supply zone.
“ETH bounced back from the $2,000 support level but got rejected from the $2,150 resistance zone,” he wrote on X. “If Ethereum manages to reclaim the $2,150 zone, it could rally quickly towards $2,250. A failure to reclaim means $2,000 will be retested soon.”
Funding rates across major derivatives exchanges have also started turning negative again, suggesting traders are increasingly positioning for downside continuation. Open interest has remained elevated despite the recent correction, a sign that leveraged bets are still heavily active in the market.
What could invalidate Ethereum’s bearish setup?
Despite mounting bearish signals, Ethereum has not yet confirmed a full trend collapse. Bulls continue defending the $2,000 region aggressively, and repeated rebounds from that area indicate that spot demand remains active at lower levels.
Any sustained move back above $2,150 would weaken the rounded top structure significantly. Such a breakout could force leveraged shorts to unwind rapidly, especially given the dense liquidation clusters sitting above resistance. In that scenario, Ethereum could revisit the $2,250 and $2,400 levels relatively quickly.
Furthermore, progress in U.S.-Iran negotiations or a sharper decline in crude oil prices could improve overall risk appetite and reduce inflation fears tied to energy markets. This would likely benefit crypto assets broadly, particularly large-cap tokens like Ethereum that remain sensitive to institutional flows.
Federal Reserve expectations remain another major variable. Traders are still closely watching incoming U.S. inflation and labor market data for clues on future interest rate policy. Any signals supporting earlier rate cuts could weaken the dollar and revive demand for speculative assets.
Stablecoin activity on Ethereum continues providing one bullish structural backdrop as well. The network still dominates global stablecoin settlement volume, and elevated issuance levels suggest underlying blockchain activity has not collapsed despite price weakness.
For now, however, Ethereum remains stuck between heavy resistance near $2,150 and fragile support at $2,000. A decisive move outside that range will likely determine whether the current structure evolves into a deeper crash or another short-term recovery rally.
Disclosure: This article does not represent investment advice. The content and materials featured on this page are for educational purposes only.



Be the first to comment