


Ethereum price consolidated near $1,917 on Aug. 10 as buyers defended the $1,900 area, but weakening short-term momentum and dense liquidity near $1,950 kept ETH inside a narrow range.
Summary
- Ethereum price traded near $1,917, holding above the daily Bollinger Band midpoint at $1,897.
- The 4-hour chart places immediate support between $1,894 and $1,900.
- Liquidation data shows large leverage clusters near $1,950 and $1,895.
- A break above $1,953 could reopen the path toward the psychological $2,000 level.
Ethereum price holds above $1,900
According to data from crypto.news, Ethereum (ETH) price was trading at approximately $1,917 at the time of writing, after moving between $1,906 and $1,931 during the latest daily session.

ETH has consolidated above $1,900 since recovering from lows near $1,800 earlier in August. The move followed renewed spot demand, short liquidations and a broader risk-asset rally after weak U.S. employment data reduced expectations for another near-term Federal Reserve rate hike.
U.S. nonfarm payrolls fell by 23,000 in July, missing forecasts for an increase of around 80,000. May and June payroll figures were also revised lower by a combined 103,000.
The softer report pushed Treasury yields lower and helped the S&P 500 close at a record on Aug. 7. Ethereum benefited from the same change in risk appetite, although the weekend advance has since lost momentum.
Washington also provided a secondary sentiment boost. Senate Majority Leader John Thune filed a motion that prepares the Digital Asset Market Clarity Act for a procedural vote after the August recess. However, the filing did not represent final passage, and lawmakers still need to resolve disputes involving government ethics, stablecoin rewards and enforcement provisions.
ETH momentum weakens below $1,950
The daily chart shows Ethereum trading in the upper half of its Bollinger Bands. The middle band stands at $1,897, while the upper and lower boundaries sit at $1,953 and $1,841, respectively.
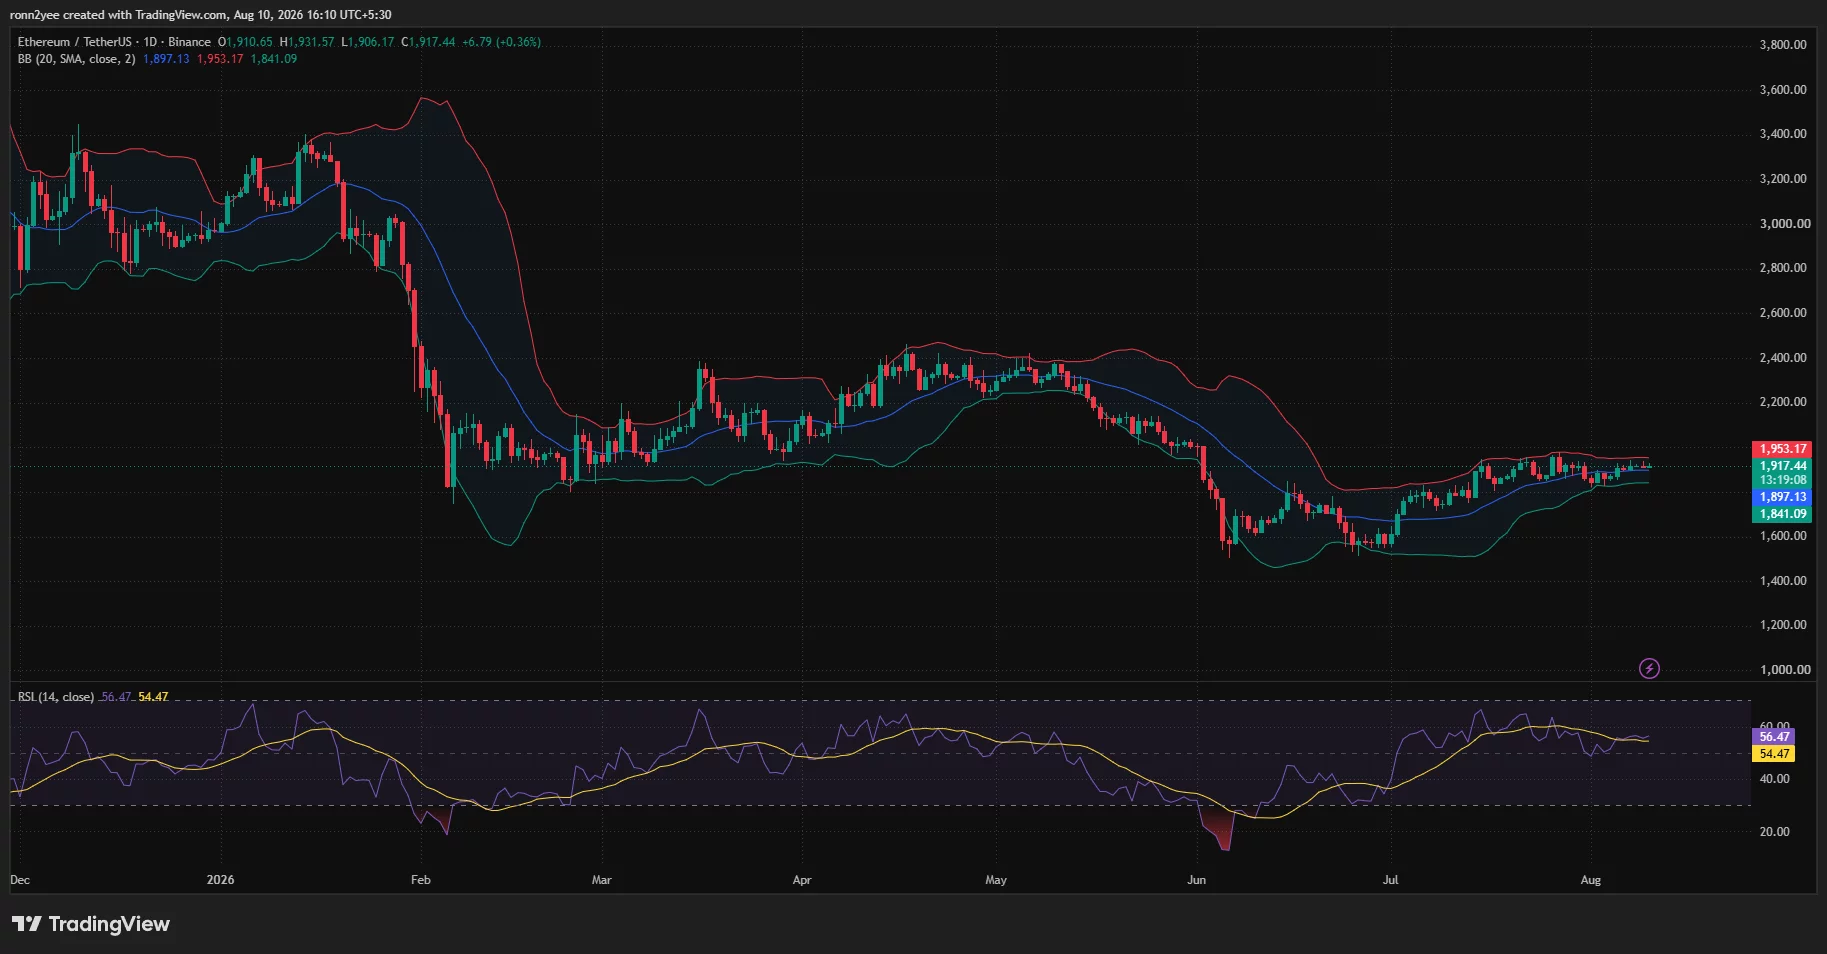
Holding above the $1,897 midpoint keeps the short-term structure tilted toward buyers. The upper band near $1,953 now forms the main technical barrier before $2,000.
The daily relative strength index stands at 56.47, slightly above its signal average of 54.47. This indicates moderate bullish momentum without placing ETH in overbought territory. However, the indicator has flattened after its latest rise, matching the sideways price action.
Shorter-term indicators show more caution. On the 4-hour chart, ETH is sitting almost directly on its 20-period simple moving average at $1,917.78. The 50- and 100-period averages are clustered at $1,894.24 and $1,894.80, creating a concentrated support area below the current price.
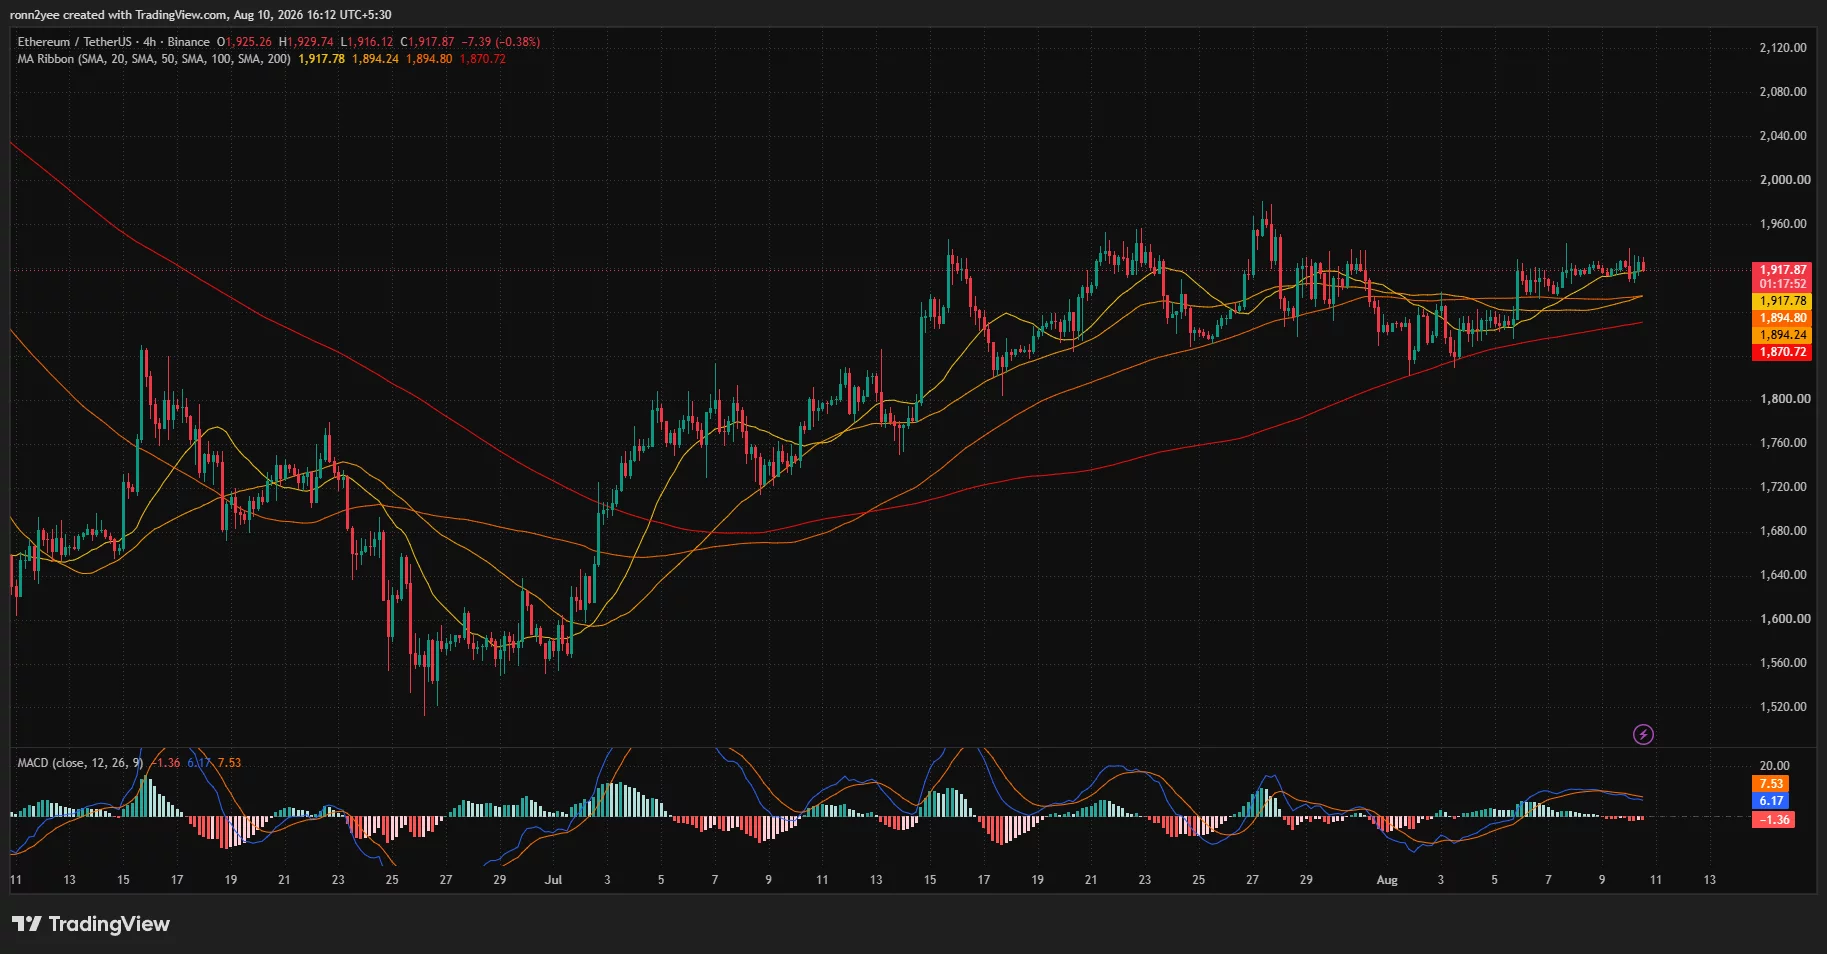
The 200-period average is lower at $1,870.72. ETH remains above all four averages, preserving the broader recovery structure despite the latest consolidation.
The 4-hour moving average convergence divergence indicator has weakened. Its MACD line stands at 6.17, below the signal line at 7.53, while the histogram has turned slightly negative at minus 1.36. That crossover suggests buyers are losing momentum, but it has not yet produced a confirmed trend reversal.
Liquidation clusters frame the next Ethereum move
CoinGlass’ 3-day liquidation heatmap shows ETH trading between two major leverage concentrations.
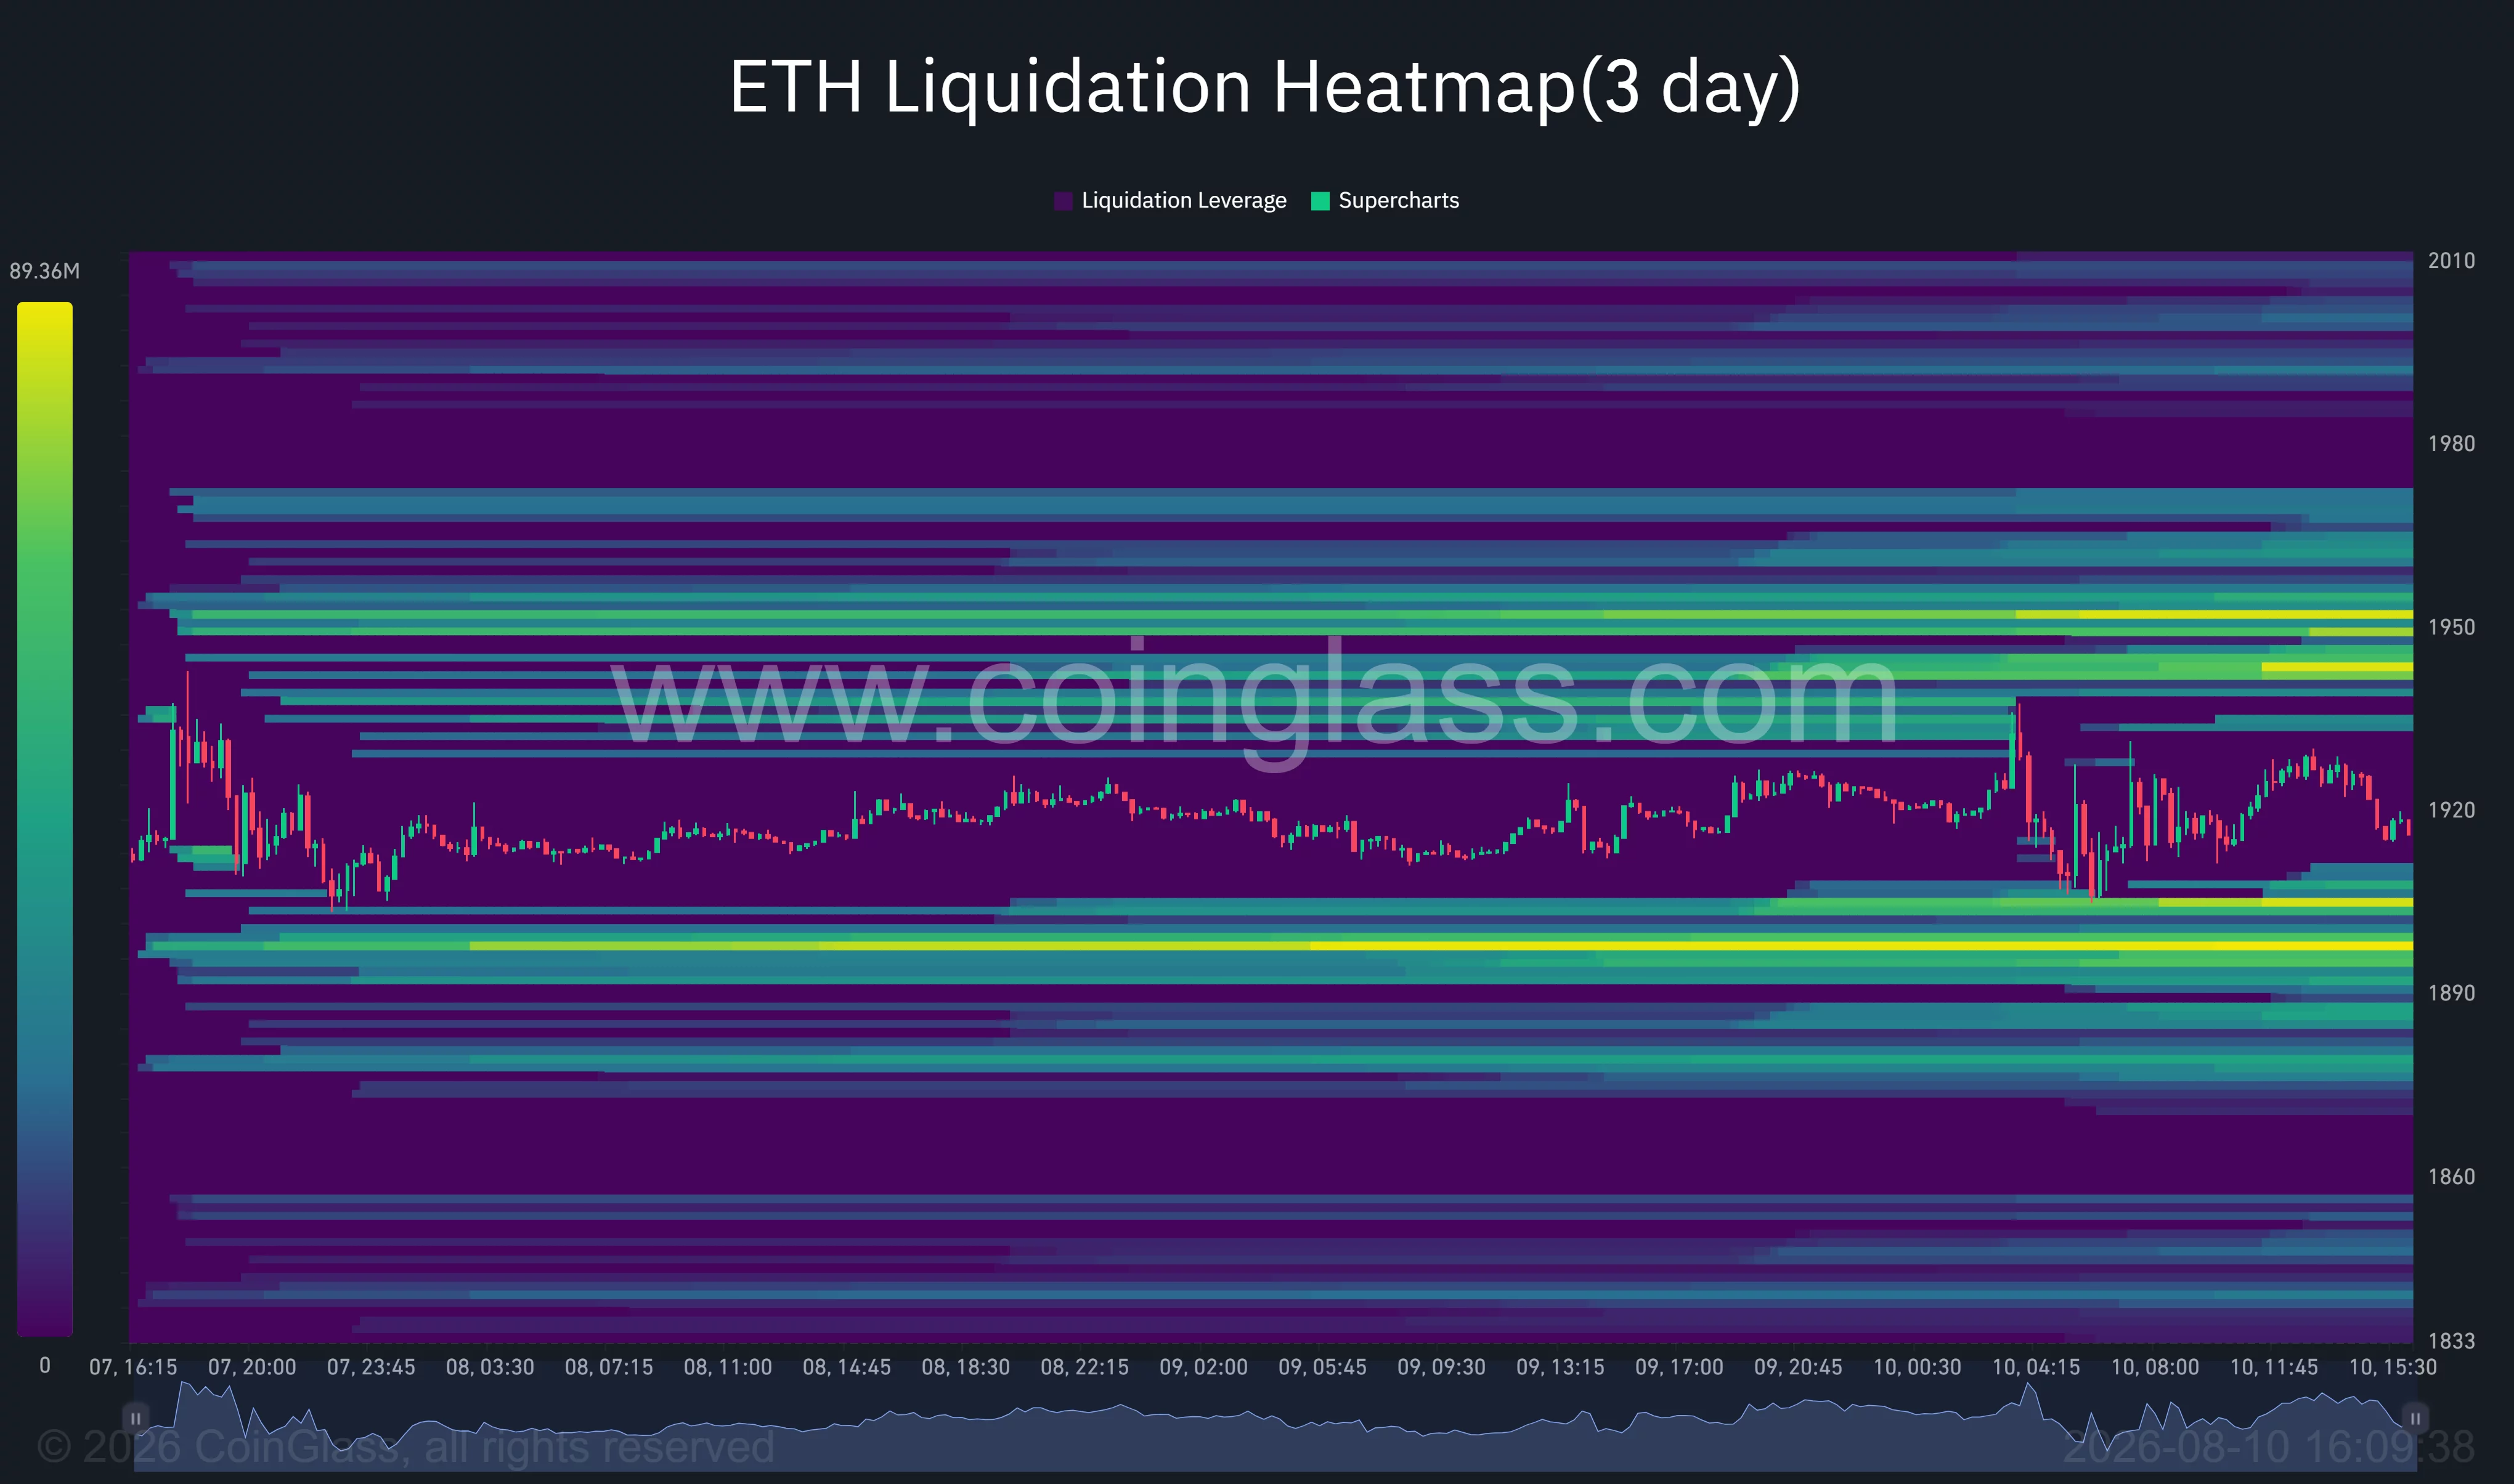
The nearest upside cluster extends from approximately $1,942 to $1,953. Liquidity is particularly dense around $1,950, making that area a possible price magnet if ETH clears its recent intraday highs near $1,930.
A move through $1,953 would also break the daily upper Bollinger Band. Bulls could then target $1,965, a resistance level identified during the previous recovery, followed by $2,000.
Crypto.news previously reported that ETH needed to defend $1,900, clear leverage around $1,925 and break $1,965 to strengthen the case for a move toward $2,000. Price has met the first two conditions temporarily, but the final breakout remains unconfirmed.
On the downside, the strongest nearby liquidation band sits around $1,895–$1,902. That cluster overlaps with the 4-hour 50- and 100-period moving averages and the daily Bollinger midpoint.
A sweep of this area could trigger leveraged long liquidations before buyers attempt another recovery. If $1,890 fails, ETH may retreat toward its 4-hour 200-period average at $1,871. The daily lower Bollinger Band at $1,841 provides the next major support.
Analysts split on the $2,000 breakout
Analyst Ted Pillows said Ethereum was “holding strongly above the $1,900 level” and identified $2,000 as the next upside target. His chart places intermediate resistance near $1,965, followed by $2,030 and $2,100 if momentum accelerates.
The bearish scenario begins if ETH loses the $1,900–$1,850 support region. Pillows’ chart points to deeper downside levels near $1,700 and $1,500 if the recovery structure breaks.
Fellow analyst Gerla offered a more cautious long-term view. Gerla said ETH was testing a descending resistance line for the third time after the previous two encounters produced sharp rejections.
“Rejection first → accumulation → breakout → $10K+,” Gerla wrote.
The projection is a speculative long-term scenario rather than a verified target. The analyst’s chart also identifies the $1,400–$1,600 region as a possible demand zone if ETH suffers another broad correction.
For the immediate outlook, the range is tighter. A confirmed close above $1,953 would favor a test of $1,965 and $2,000. Losing $1,894 would instead expose $1,871 and $1,841, placing the current recovery at risk.
Disclosure: This article does not represent investment advice. The content and materials featured on this page are for educational purposes only.


Be the first to comment