



Ethereum price is heading into a significant support area as the latest bullish breakout attempts to pass a technical test. Positive momentum and increasing institutional demand from ETFs have helped the asset, but it all comes down to what happens near the new support level.
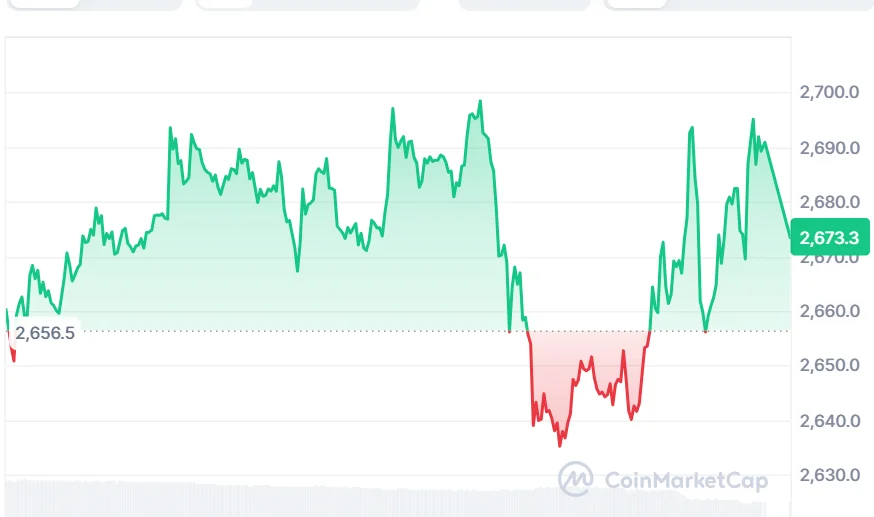
At the time of writing, ETH is trading at $2,673.39, up 0.40% over the last 24 hours, with a 24-hour trading volume of about $23.17 billion and a market capitalization of $328.12 billion.
Ethereum Price Approaches Former Resistance Zone
On September 24, a crypto analyst, BATMAN, pointed out that the $2,560-$2,600 level is significant for Ethereum, as this level used to serve as a resistance and has now been tested as a support several times.
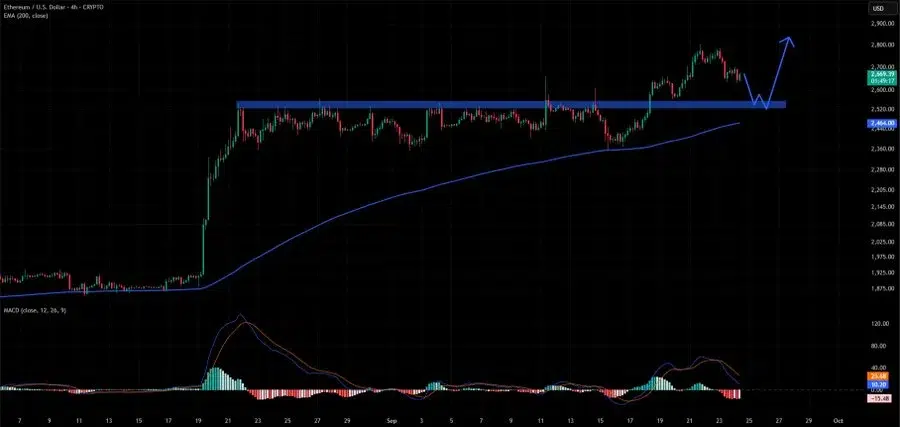
The significance of this level lies in the further price move of ETH, because a possible breakout from this level by Ethereum during a retreat will mean that a reversal of the resistance level to a support level has taken place.

The 200 EMA comes in at roughly $2,460, giving yet another technical level above the $2,560-$2,600 range. Such a shift in price action would hence see the more significant part of the recent recovery come under scrutiny.
It gives a precise target for investors to look out for: for the recent recovery to hold, Ethereum will have to protect its previously established resistance level.
Also Read | XRP ETF Inflow Reaches $1.73 Billion as XRP Price Drops 7%
Ethereum Price Maintains Bullish Setup
ETH is trading around the top Bollinger Band level at $2,767.17. The middle Bollinger Band is seen at the $2,547.65 level. The lower Bollinger Band is at the $2,328.12 level, meaning that ETH is trading above the middle of the range. Price staying above the middle Bollinger Band creates a favorable chart pattern.
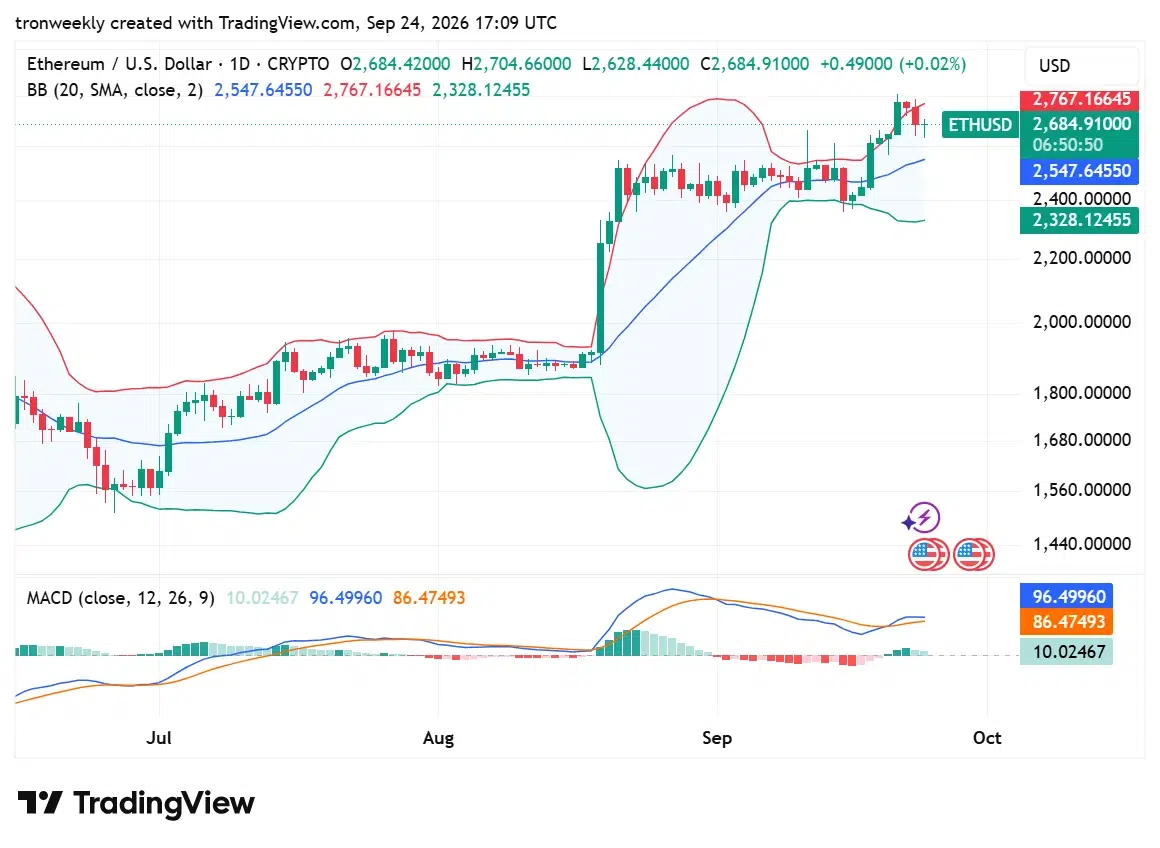
The MACD indicator is also a bullish indicator, with the MACD line being at the 96.50 point and the signal line being at the 86.47 point. The histogram is positive as well, and it stands at the 10.02 point. This means that the buying momentum is still there. However, the gap between the two lines is rather small, and therefore momentum may slow down.
BlackRock Ethereum ETF Demand Adds Institutional Support
Technical indicators are not the only reason for staying focused on Ethereum.
Net inflows to US spot Ethereum ETFs have been around $104.5 million on September 23, yet another positive day for institutions. The iShares Ethereum Trust ETF (ETHA) by BlackRock is the leader with net inflows of $50.8 million, while Fidelity’s FETH has seen net inflows of around $41.3 million.
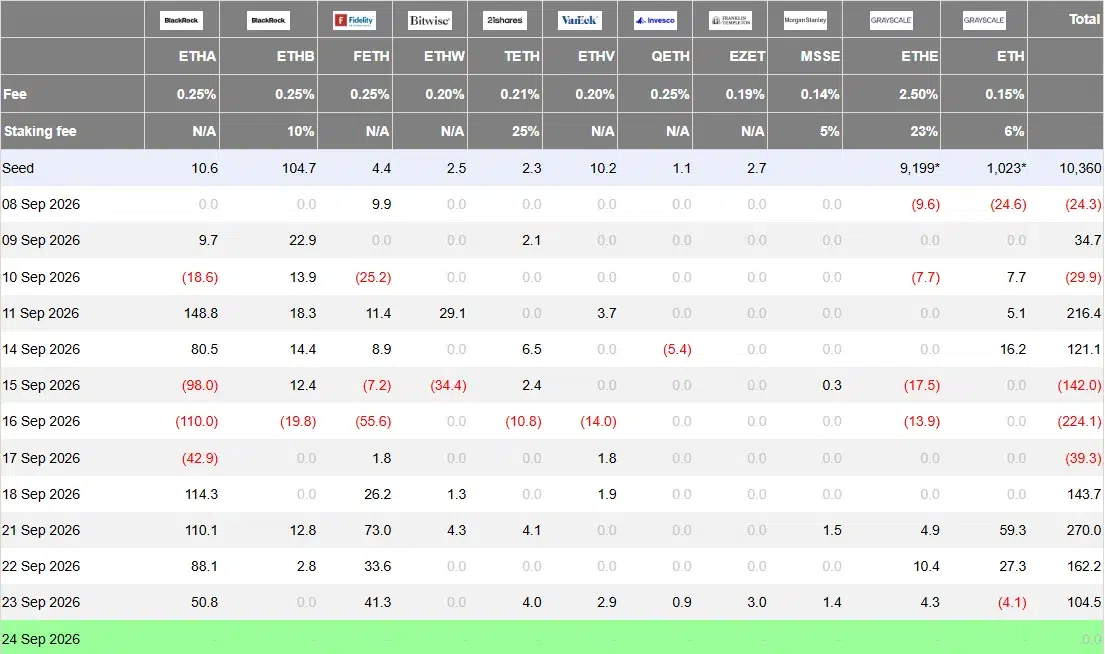
$50.8 million BlackRock ETF inflow was especially significant as it constituted nearly half of the daily net inflow into U.S. spot Ether ETFs.
What Happens Next for Ethereum Price?
The next crucial test would be if Ethereum turns its way toward the $2,560-$2,600 range. A successful hold of this zone will allow retaining the integrity of the converted resistance-to-support zone. Above the mentioned level, the price would have to handle the $2,700 region along with the top Bollinger Band at $2,767.
However, a failure below $2,560 will break the short-term setup and will put the focus on the $2,460 200 EMA support zone.
Nevertheless, in either case, what needs to be noted at this point is that the price bounce of Ethereum is tested exactly when there is institutional interest via ETFs. The price behavior around the $2,560-$2,600 zone, along with the ETF trend, will give many hints about the future Ethereum rally.
Therefore, investors need to focus on two crucial factors: firstly, whether the Ethereum resistance turns into a support level; secondly, whether institutions invest in the Ethereum funds.
Also Read | Binance HYPE Listing Signals Growing Interest in Hyperliquid’s Ecosystem
This article contains market analysis and price predictions. These are not guarantees. Crypto markets are volatile. Always DYOR. Not financial advice.


Be the first to comment