


Ethereum price has retreated from a two-month high after traders locked in profits, though analysts still expect a push toward $2,000 while key support holds.
Summary
- Ethereum price pulled back after a 5% CPI-driven rally as traders booked profits near $1,930.
- Strong support around $1,850 keeps the technical outlook intact, with $2,000 remaining the next key target.
- Liquidation clusters, ETF flows, and Fed expectations will likely determine Ethereum’s next move.
The June U.S. CPI and PPI data initially fueled a risk-on move across crypto markets, lifting ETH more than 5% before sellers emerged near a major resistance area. The rally briefly pushed Ethereum above a multi-month descending trendline, but momentum faded around $1,930 as short-term traders adopted a classic sell-the-news strategy.

The pullback drove Ethereum (ETH) price as low as $1,878 before buyers returned around the $1,880 region, which now serves as the first line of support after the breakout attempt.
Derivatives activity accelerated the reversal. Funding rates climbed as leveraged longs entered the market during the move above $1,900, leaving positions vulnerable once upside momentum stalled. The retreat triggered a wave of long liquidations across major exchanges, adding forced market-selling pressure to an already weakening spot market.
Macro markets also turned less supportive as the trading session progressed. Oil prices rebounded sharply after the inflation data, reviving concerns that energy costs could complicate the Federal Reserve’s path on interest rates.
Treasury yields moved higher alongside the U.S. Dollar Index, reducing appetite for risk assets and encouraging some investors to rotate capital toward traditional fixed-income markets instead of cryptocurrencies.
Technical structure continues to favor another test of $2,000
Ethereum’s 4-hour chart still presents a constructive technical picture despite the latest rejection. Price has completed a second rounded-bottom formation after rebounding from the June lows near $1,500 and recently reclaimed the horizontal resistance around $1,850.
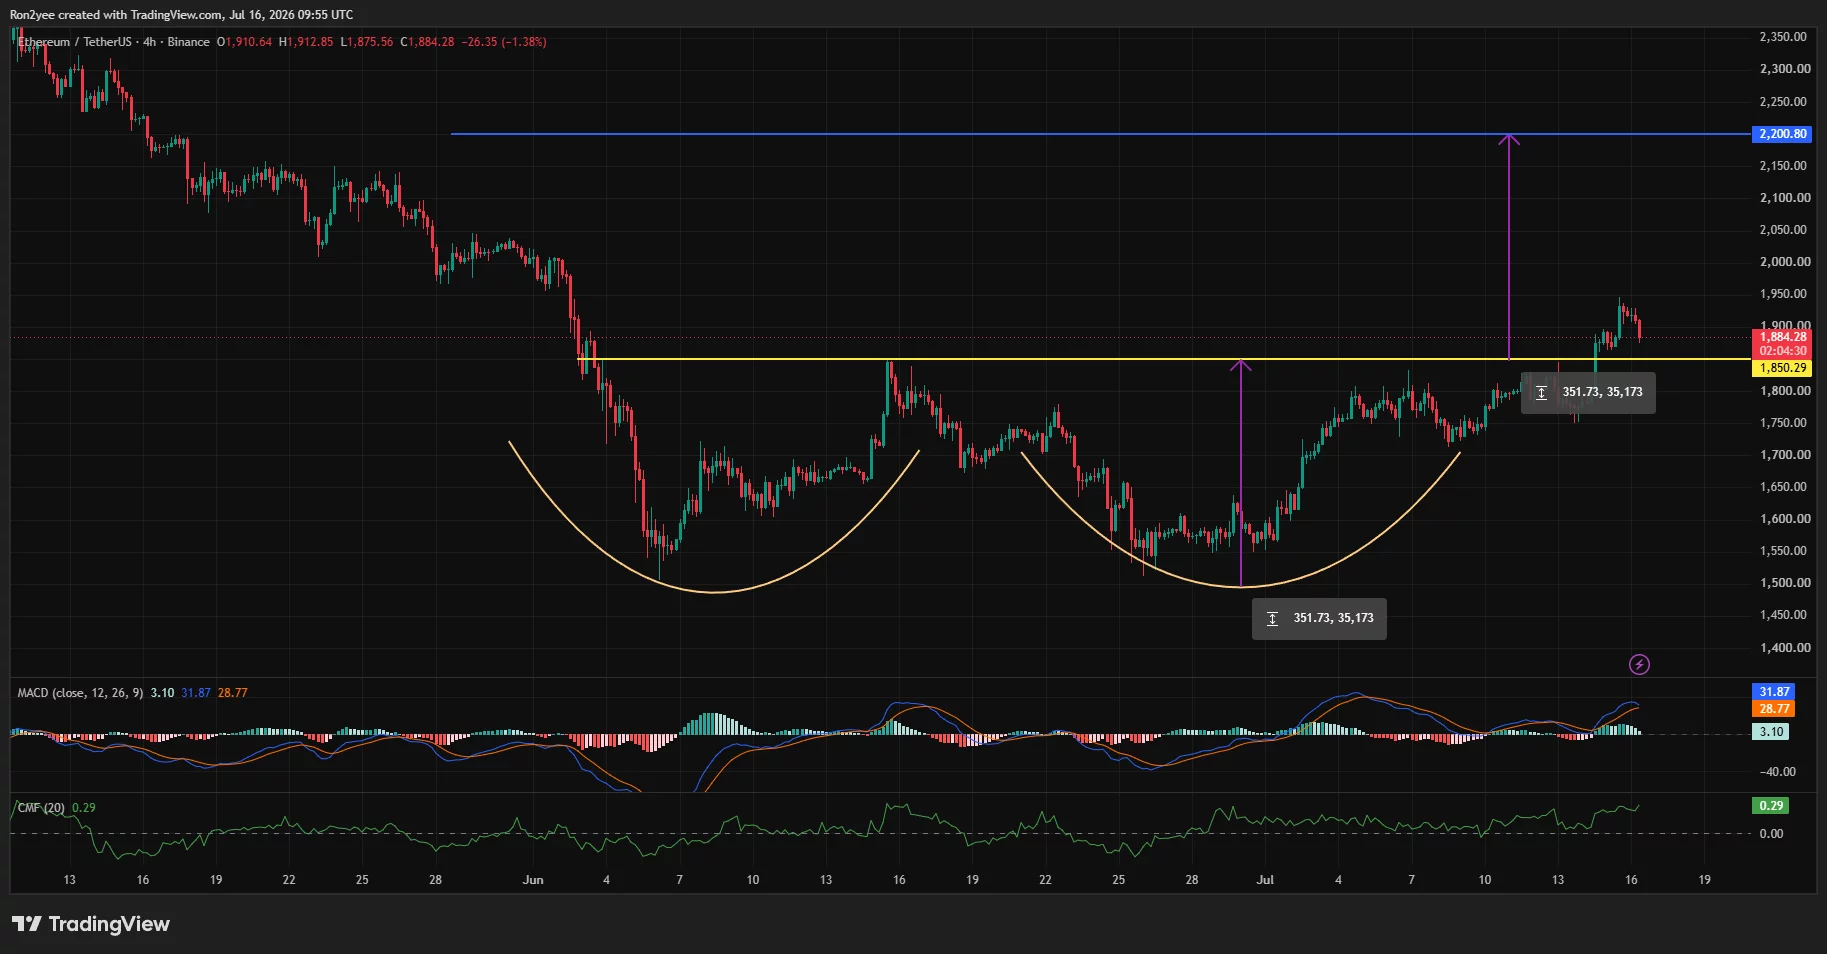
This former ceiling now represents the primary support level, while the measured move from the pattern projects an upside target near $2,200 if buyers regain control above the recent highs.
Momentum indicators continue to lean positive. The MACD remains above the zero line with its signal line intact despite a modest slowdown after the rejection, while the Chaikin Money Flow holds around 0.29, showing capital has continued entering Ethereum over recent weeks instead of exiting the market. Together, those indicators suggest the recent decline has so far resembled profit-taking rather than a complete trend reversal.
Liquidation data also identifies the next battleground. CoinGlass’ 3-day ETH liquidation heatmap shows one of the largest clusters of leveraged positions concentrated between roughly $1,840 and $1,860, reinforcing the importance of that support zone.
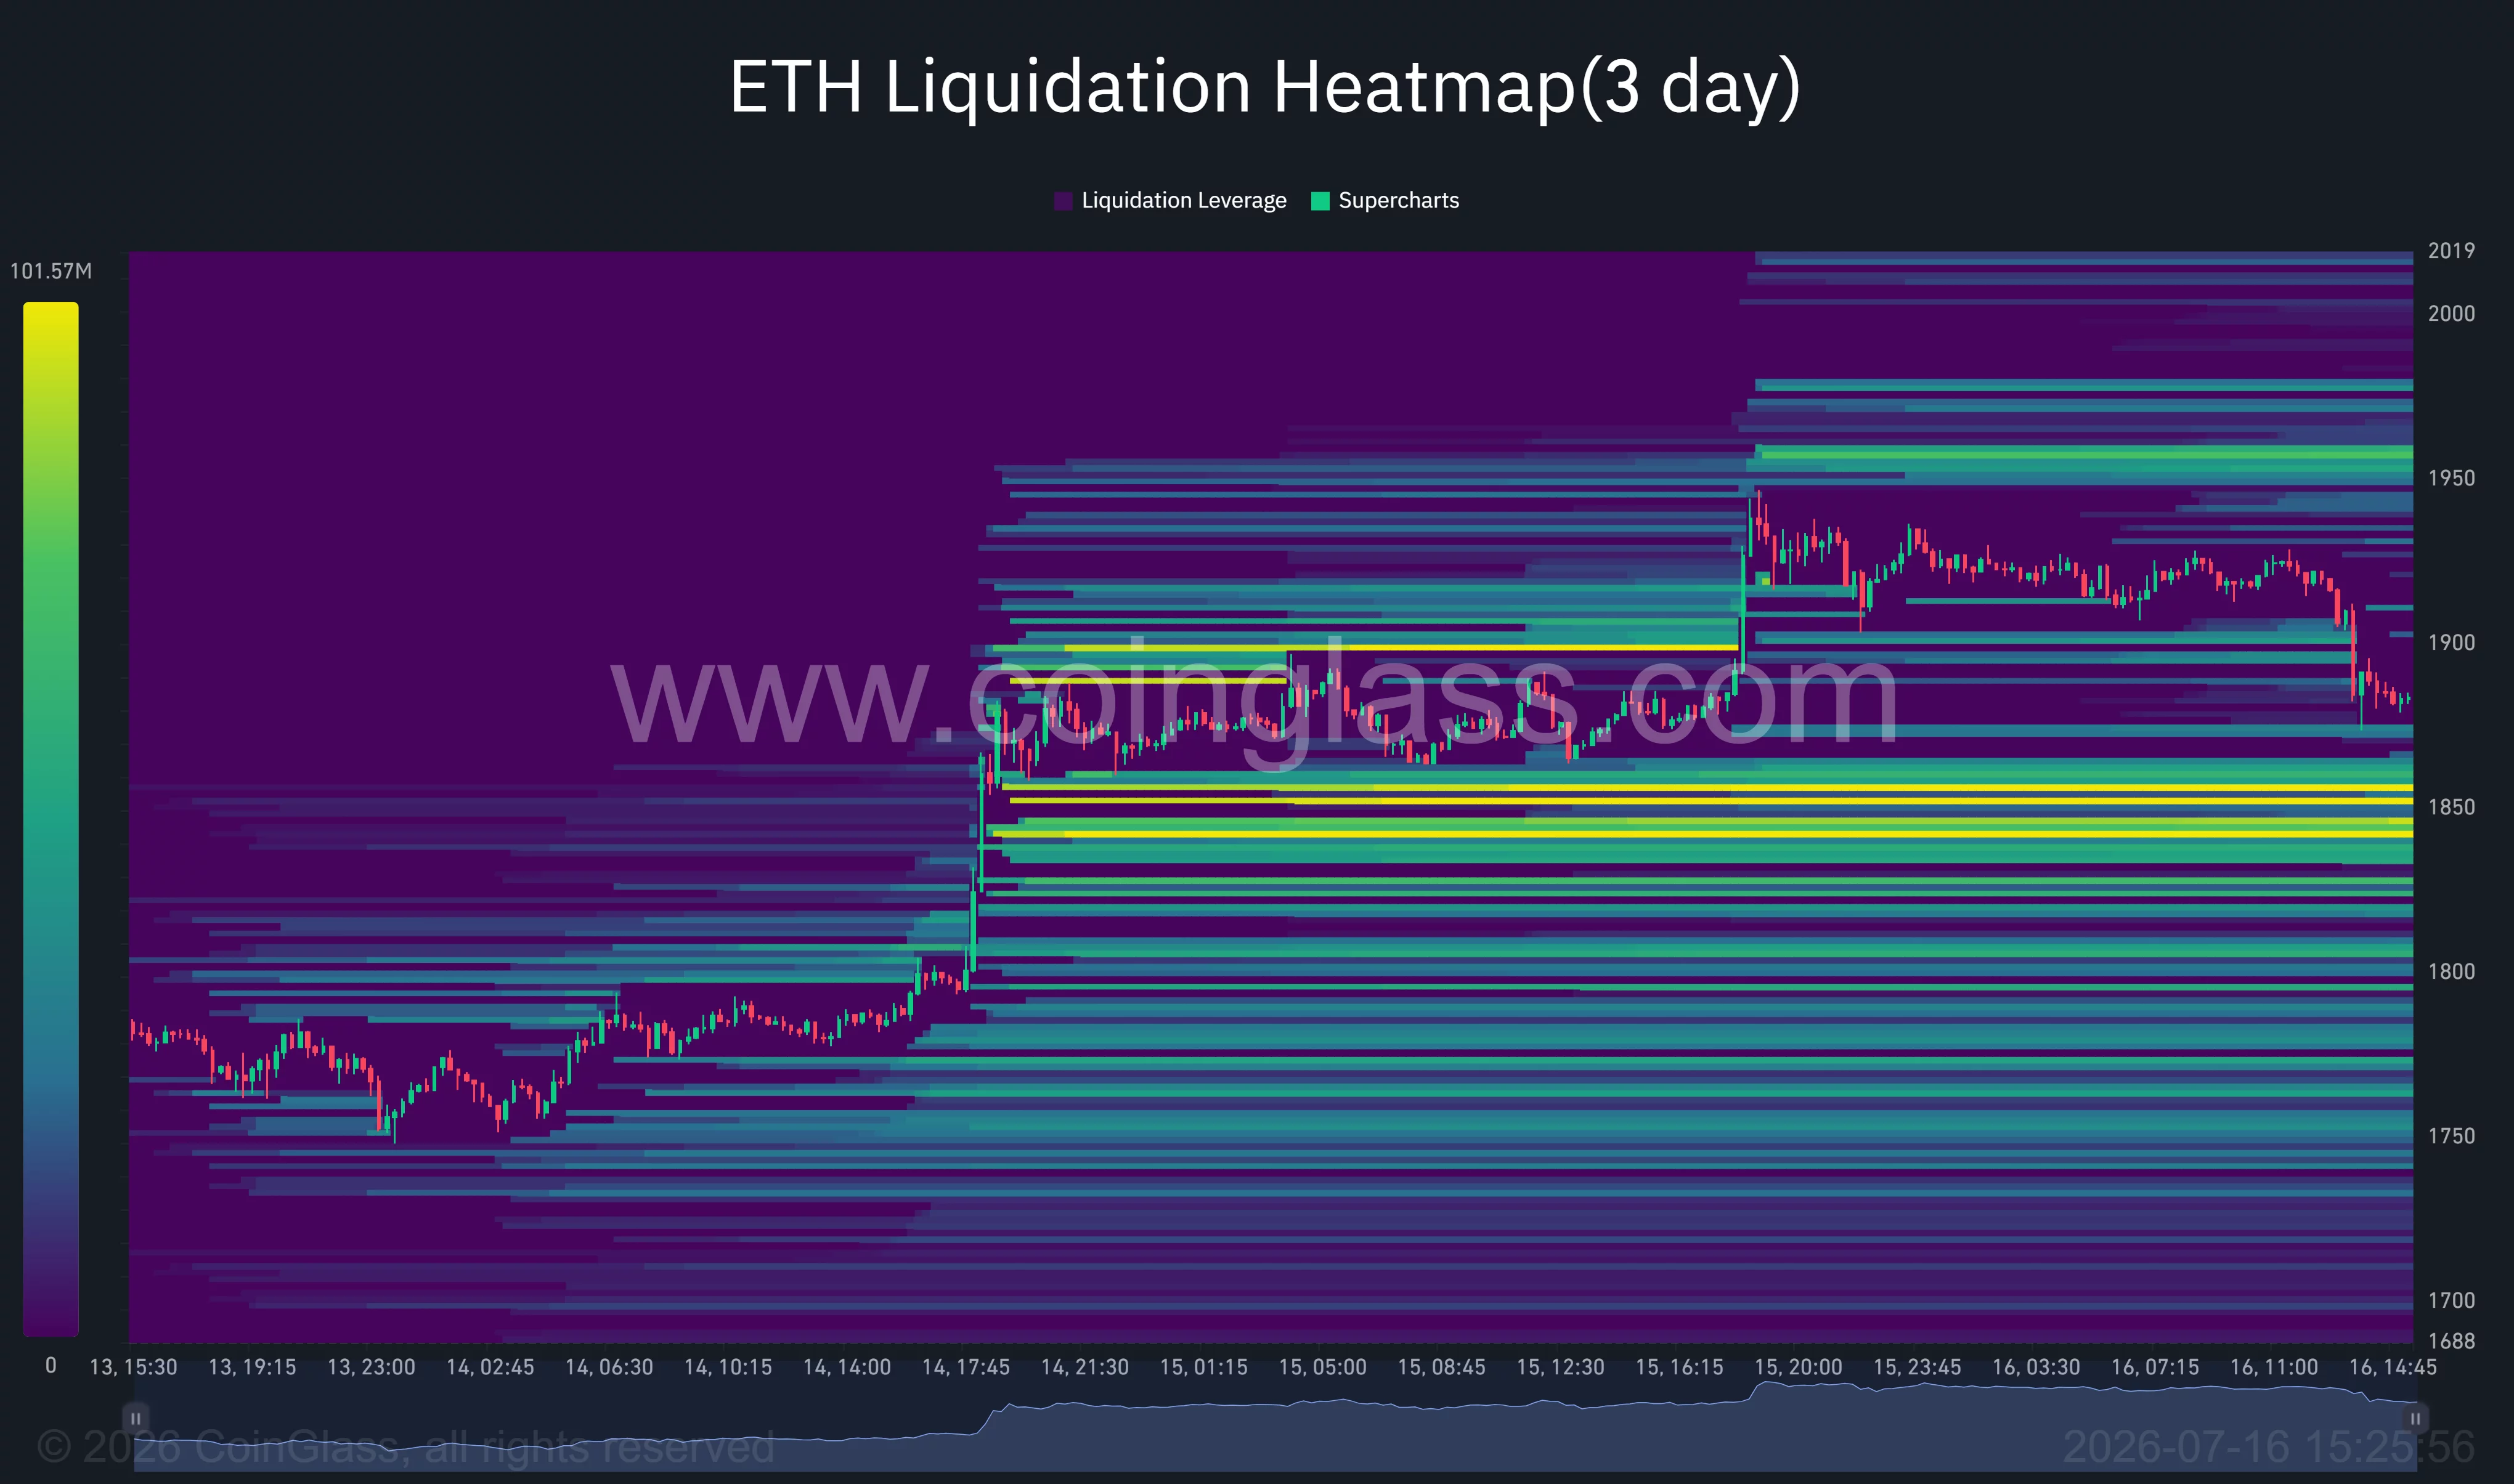
A successful defense there could allow Ethereum to target liquidity around $1,950 before challenging the psychological $2,000 level, where another large concentration of short liquidations sits waiting above price.
Commenting on the move, analyst Ted Pillows noted the recent decline remains a healthy pause rather than the start of a larger correction.
“As long as Ethereum holds above the $1,850 level, the next move will be towards $2,000.”
Separately, according to Michaël van de Poppe, the current environment remains a buy-the-dip market, adding, “There’s a lot more upside going to come on this one.”
Loss of $1,850 could delay the bullish breakout
Several risks could still invalidate Ethereum’s recovery. A decisive break below the $1,850 support would negate the recent breakout and expose the asset to a deeper retracement toward the $1,750-$1,800 region, where another concentration of liquidity has formed. Failure to hold that area would shift attention back toward the June base near $1,500.
Outside the charts, macro developments remain an important variable. Renewed strength in the U.S. dollar, higher Treasury yields, persistent spot ETF outflows, or fresh geopolitical tensions that lift energy prices could reduce demand for crypto assets again.
Exchange inflows from larger holders and continued capital rotation into AI and technology equities also present headwinds, making sustained spot buying essential if Ethereum is to convert its recent breakout into a move above $2,000.
Disclosure: This article does not represent investment advice. The content and materials featured on this page are for educational purposes only.



Be the first to comment