



Ethereum price is now back above the $2,400 mark, but declining interest in ETFs and a bearish momentum signal pose worries about the ability of ETH to hold on to its gains.
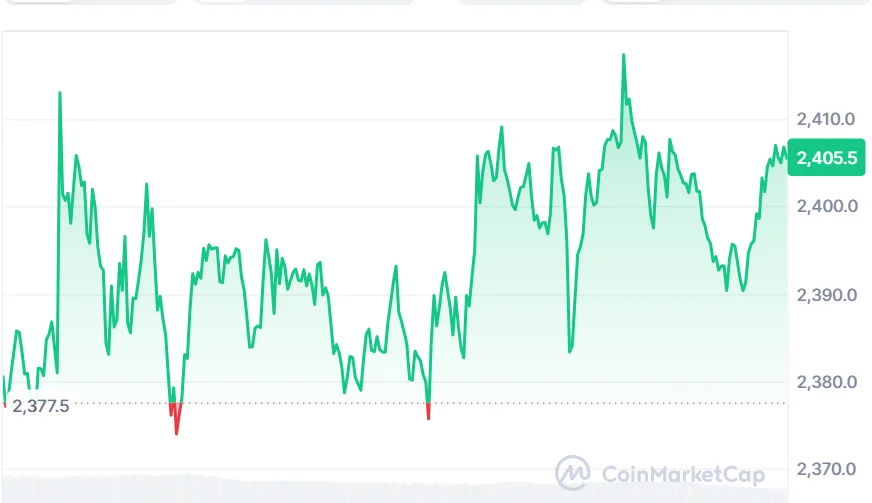
At the time of writing, ETH is trading at $2,405.5, up 1.18% over the last 24 hours, with daily trading volume of $14.37 billion and a market capitalization of approximately $293.32 billion.
Ethereum Price Faces ETF Outflow Warning
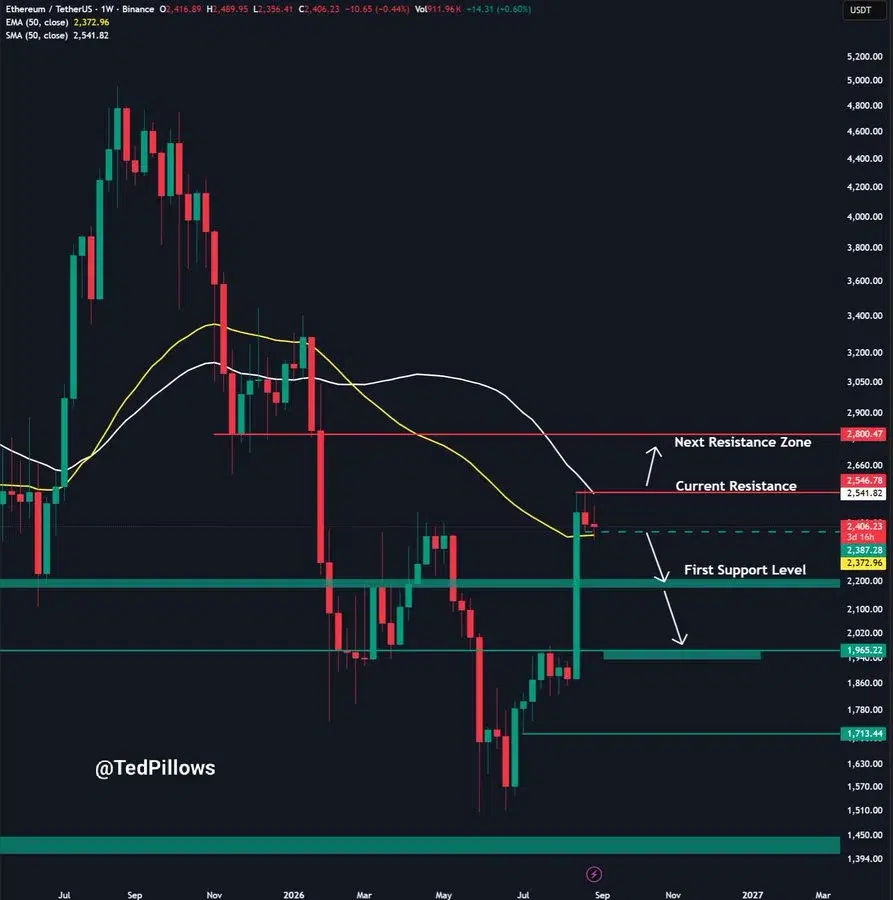
On September 3, 2026, a well-known crypto analyst, Ted, mentioned the rise of the Ethereum price back to above $2,400 while noting a possible red flag about spot ETF flows.
As per Ted’s analysis, any close below $2,350 on a weekly basis will open the door for the Ethereum price to fall further to $2,200. This price point will constitute a serious correction from the present price levels.

The total outflow in U.S. spot Ethereum ETFs amounted to around $48 million on September 2. This reversed a streak of 12 sessions where there had been net inflows of $1.62 billion.
This is important since ETF flows have become an important factor for assessing the interest of institutions in Ethereum. The constant flow of funds into the ETF can give some additional purchasing power, while its constant outflow will be problematic for maintaining high prices on ETH.
Also Read | Payward Reportedly Pushes Kraken IPO Timeline Into Q2 2027
Ethereum Struggles as Technical Signals Flash Warning
The significance of the $2,350 level is further reinforced by the overall price structure of the Ethereum coin. At present, ETH is trading above the midpoint of the Bollinger Bands at $2,325.039. Until this level holds up, the overall technical structure of the asset has a positive aspect. But the loss of both these levels could reinforce the bearish outlook.
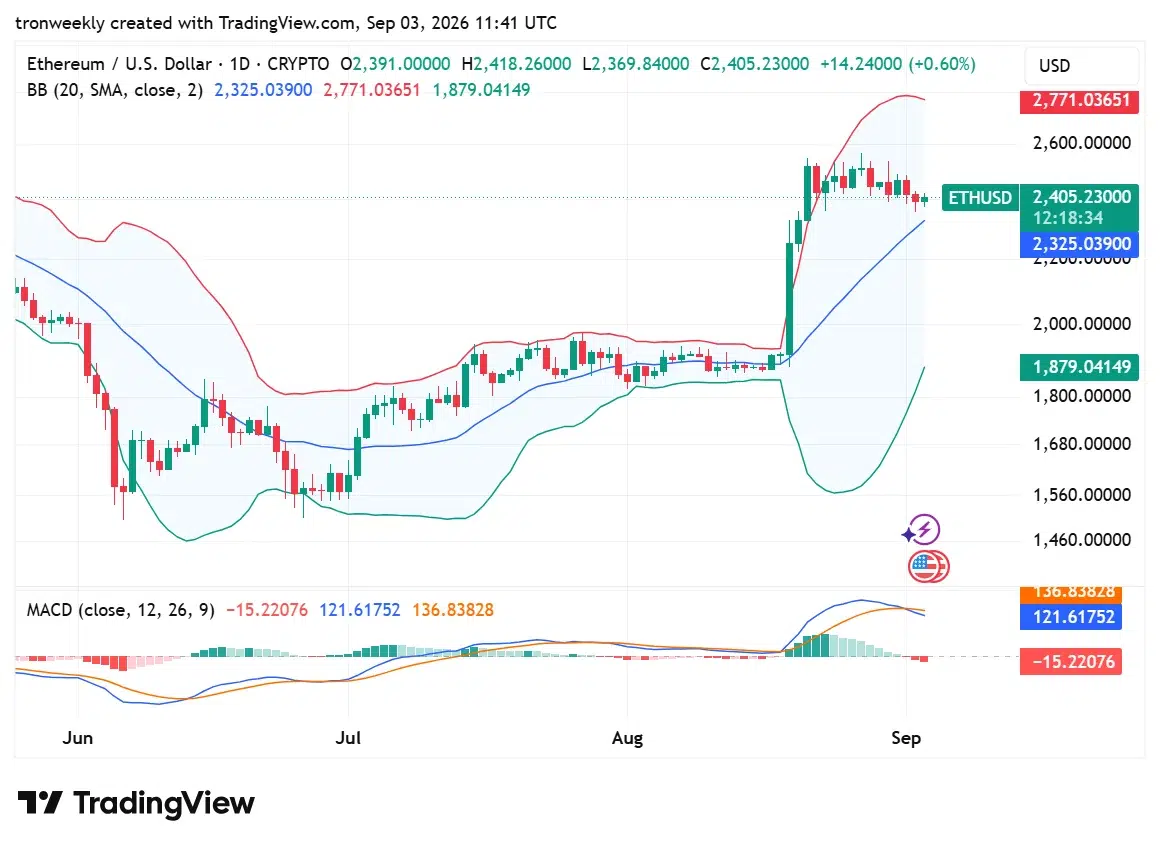
MACD stands at 121.61752, which is below the signal line at 136.83828, and the histogram is at -15.22076, suggesting that the upward momentum has been eroded and ETH is set for further downward pressure.
Bollinger bands have been giving conflicting signals, as the upper band is near $2,771 and the lower band is near $1,879. The large space between the two bands is an indication of volatility in the prices.
ETH above the middle band is positive, but with range-bound prices, weakening momentum in MACD, and outflows from the ETFs, there appears to be a need to defend the current price levels first.
What Happens Next for ETH?
The most significant test for Ethereum price will be to sustain prices above $2,350 before reclaiming the $2,500 level.
Being able to sustain prices above $2,350 would allow the bulls to continue with the ongoing recovery pattern and take prices to more elevated levels of resistance.
Meanwhile, a breakdown below $2,350 on a weekly basis would be detrimental to the technical formation. In such a case, the support zone at $2,200 takes on significance, especially if the flow of money from the ETFs is persistent and MACD is still below its signal line.
For the moment, Ethereum price finds itself in a conflicting situation, where price is holding above the technical median level, but other indicators are deteriorating.
Also Read | DOT Price Prediction: DOT Eyes $0.91 Recovery Amid Network Growth
This article contains market analysis and price predictions. These are not guarantees. Crypto markets are volatile. Always DYOR. Not financial advice.



Be the first to comment