


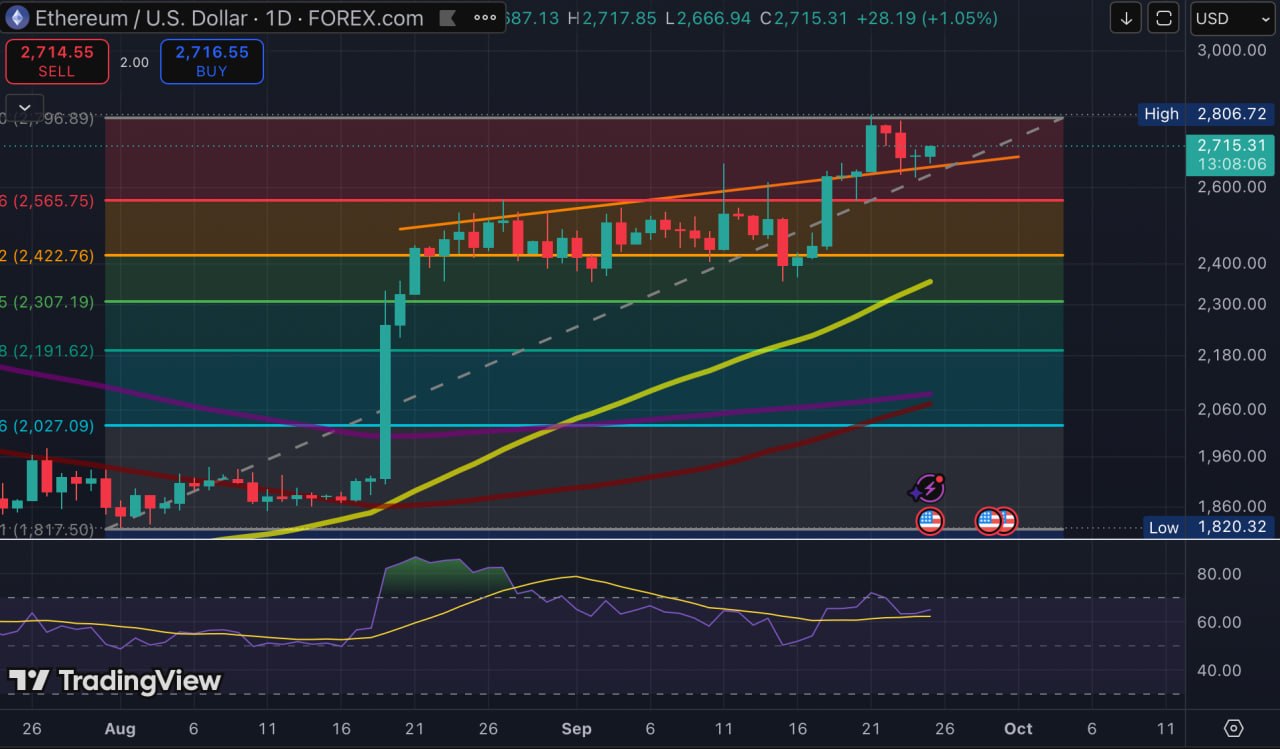
Ethereum is holding above its reclaimed daily diagonal, but the next close must defend the retest before ETH can make a credible push toward $2,800.
Key Takeaways
- The diagonal sits near $2,660-$2,680.
- $2,800-$2,807 caps the visible daily range.
- $2,560 and $2,420 define the fallback.
ETH is now between a moving floor and $2,800
At the time of writing, ETH traded near $2,715 after reaching $2,807. It had pulled back toward the reclaimed diagonal, which sat around $2,660-$2,680 at that point, which was acting as resistance before breaking above $2,600.
The daily setup follows the larger move Coindoo examined when ETH broke its year-long weekly trendline. The weekly break established the broader recovery case; the current chart asks whether buyers will defend the level they have just reclaimed.
Today’s candle is still open, so a wick below the diagonal would not settle the question. A daily close beneath it would carry more weight, showing that sellers regained control of the line by the end of the session.
A loss of $2,560 would change the map
The Fibonacci levels are measured on the visible daily range from the $1,800 low to the $2,807 high. The 23.6% retracement sits near $2,560, making it the first static support below the diagonal. A pullback to that level would be deeper, but it would not by itself erase the wider recovery.
What changes the picture is a failure to hold it. If ETH loses $2,560 on a closing basis, the next chart level sits around $2,420, where the 38.2% retracement meets the earlier consolidation area. That sequence is more useful than treating every small intraday drop as a breakdown.
Momentum has cooled without turning weak
Daily RSI is near 60, showing positive momentum without an overbought reading. It provides useful context, but cannot prove that the diagonal will hold or that ETH will clear $2,800.
The next close sets a clear hierarchy. Holding the moving diagonal keeps the retest alive; a close above $2,800-$2,807 strengthens it, while losing $2,560 shifts the focus to $2,420. The chart is also developing while U.S. and Iranian negotiators were exploring a phased path that could reopen the Strait of Hormuz and lift the U.S. economic blockade, though no deal has been confirmed. A credible de-escalation could improve broader risk appetite by easing oil-supply fears and the geopolitical risk premium; a breakdown in talks could reverse that relief. Those headlines do not alter Ethereum’s network fundamentals, so the chart remains the cleaner test of whether traders are turning diplomatic optimism into sustained demand.
This article is provided for informational purposes only and does not constitute financial or investment advice. Cryptocurrency prices are volatile, and technical levels can change quickly.

Kosta has reported on cryptocurrency markets and blockchain infrastructure since 2020, bringing over six years of hands-on experience in the crypto industry built through daily tracking of markets, trends, and emerging blockchain developments. Specializing in Bitcoin on-chain analysis, institutional ETF flows, and digital asset price action, his work at Coindoo has been cited by other news agencies and consistently covers market developments with a focus on data-driven reporting across Bitcoin, Ethereum, Solana, and XRP.
Over the years, Kosta has contributed to multiple crypto media outlets in different regions, authoring over 6,000 articles across the sector. His reporting spans cryptocurrency markets and the broader fintech industry, tracking not only price action but also the technological and regulatory forces shaping the ecosystem.
To support his analysis, Kosta actively leverages on-chain data and metrics from leading platforms such as Santiment, Glassnode, and CryptoQuant, enabling deeper, evidence-based market insights. He believes in the power of transparency and the data that underpins the blockchain ecosystem.
His academic background in Marketing Management from Denmark further complements his analytical approach, adding a strong understanding of communication strategy and content positioning to his work.



Be the first to comment