



Here is a technical analysis of ETH/USDT on the daily timeframe:
Market Overview
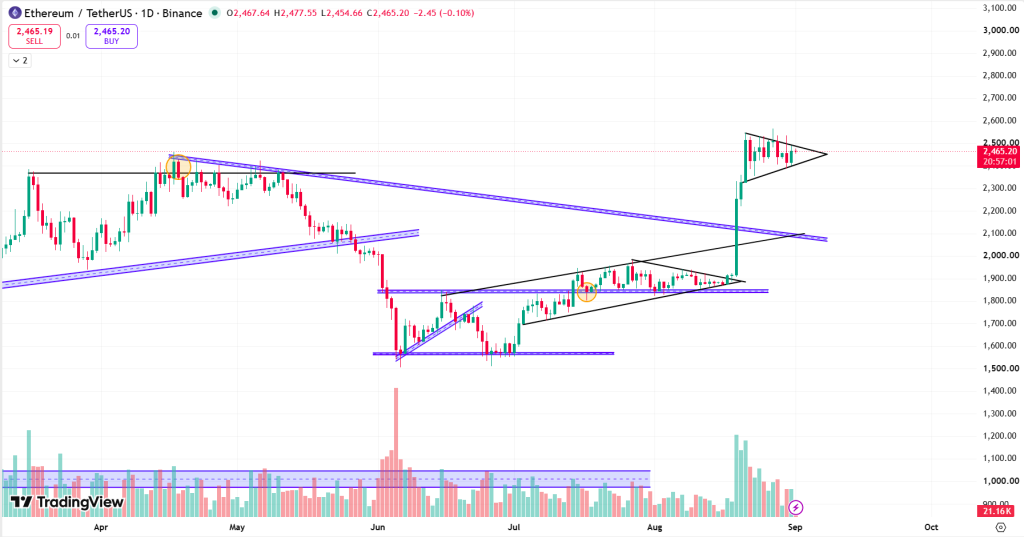
ETH is showing a strong bullish structure on the daily chart. After forming a major base around $1,550-$1,600, ETH recovered toward the $1,850 resistance and subsequently broke out strongly in August. The breakout was accompanied by a significant volume expansion, with ETH moving rapidly from around $1,900 to the $2,500-$2,550 region. Following this sharp upward move, the price has entered a consolidation phase, forming a Bull Flag-type structure. This is generally considered a bullish continuation setup when the price breaks above the upper boundary with strong volume.
Technical Analysis
Bull Flag & Pole Formation
The chart clearly shows:
- Pole: Strong upward move from approximately $1,850-$1,900 to $2,550.
- Flag: Short-term consolidation between approximately $2,350 and $2,550.
- The price is currently trading around $2,465, inside the flag.
- Volume increased sharply during the pole and has subsequently reduced during consolidation, which supports the continuation setup.
Also Read: Chelsea FC and Circle Join Forces to Bring USDC to Football

Key Levels
Resistance
- $2,500-$2,550: Upper flag resistance and key breakout zone
- $2,600: Immediate psychological resistance after the breakout
- $2,800-$3,000: Next major upside zone
- $3,100-$3,200: Potential extended target area
Support
- $2,350-$2,400: Immediate flag support
- $2,300: Secondary support
- $2,100: Major trendline/support area
- $1,850: Major previous breakout support
Outlook
The daily chart shows a strong pole followed by a flag consolidation, making the current structure favorable for a potential bullish continuation. The $2,550 breakout level is the most important level to watch. A confirmed breakout with strong volume could open the path toward $2,800-$3,000, with the measured flag-and-pole target extending toward approximately $3,150-$3,250.
At the time of writing, ETH was trading at approximately $2,465.
Summary
ETH remains bullish on the daily timeframe. The chart shows a strong bullish pole from $1,850 to $2,550, followed by a flag consolidation around $2,350-$2,550. A strong daily breakout above $2,550 could confirm continuation toward $2,800-$3,000, with a measured target around $3,150-$3,250. The setup would weaken below $2,350-$2,400, with $2,100 and $1,850 acting as major downside supports.
Support and Resistance Levels
| Support 2 | Support 1 | Asset | Resistance 1 | Resistance 2 |
| $2,150 | $2,350 | ETH | $2,550 | $2,800 |
In the grand scheme of things, ZebPay blogs are here to provide you with crypto wisdom. Get started today and join 6 million+ registered users to explore endless features on ZebPay!
Disclaimer:
Crypto products and NFTs are unregulated and can be highly risky. There may be no regulatory recourse for any loss from such transactions. Each investor must do his/her own research or seek independent advice if necessary before initiating any transactions in crypto products and NFTs. The views, thoughts, and opinions expressed in the article belong solely to the author, and not to ZebPay or the author’s employer or other groups or individuals. ZebPay shall not be held liable for any acts or omissions, or losses incurred by the investors. ZebPay has not received any compensation in cash or kind for the above article and the article is provided “as is”, with no guarantee of completeness, accuracy, timeliness or of the results obtained from the use of this information.


Be the first to comment