



Here is a technical analysis of ETH/USDT on the daily timeframe:
Market Structure and Price Action
ETH is trading near $2,311 on the daily chart, and the visible structure has weakened considerably. After advancing towards the $2,500 area, the price failed to sustain the move and subsequently broke below the rising trendline that had supported the earlier recovery. The sharp decline and sequence of lower highs and lower lows indicate that sellers currently have control of the short-term trend. The latest candles are clustered near $2,300, suggesting that the price is testing an important near-term support area; however, the chart does not yet show a convincing bullish reversal pattern.
Support, Resistance, and Key Levels
The $2,300 area is the first level to monitor because the price is trading close to it, and it may act as immediate support. If ETH closes decisively below this zone, the next downside areas to watch are approximately $2,200 and $2,100. These are potential reaction zones, not guaranteed turning points. On the upside, $2,380-$2,420 is the first resistance area, followed by $2,480-$2,520, where previous price activity may attract selling. The former trendline breakdown region around $2,680-$2,730 represents a more significant overhead resistance zone. A recovery would need to reclaim resistance and form higher highs and higher lows before the broader structure could be considered improved.
Also Read: Centralised AI vs. Decentralised AI

Volume and Momentum Analysis
The chart shows noticeable volume expansion around the recent sell-off, which supports the interpretation that the decline has been accompanied by meaningful selling activity. Volume is most informative when assessed alongside the candle close and follow-through: a daily close below $2,300 with rising volume would strengthen the bearish breakdown case, whereas a rejection of lower prices followed by stronger buying volume could indicate demand entering the market. The latest candles alone do not confirm that selling pressure has ended. Volume should therefore be monitored for confirmation rather than treated as a standalone prediction.
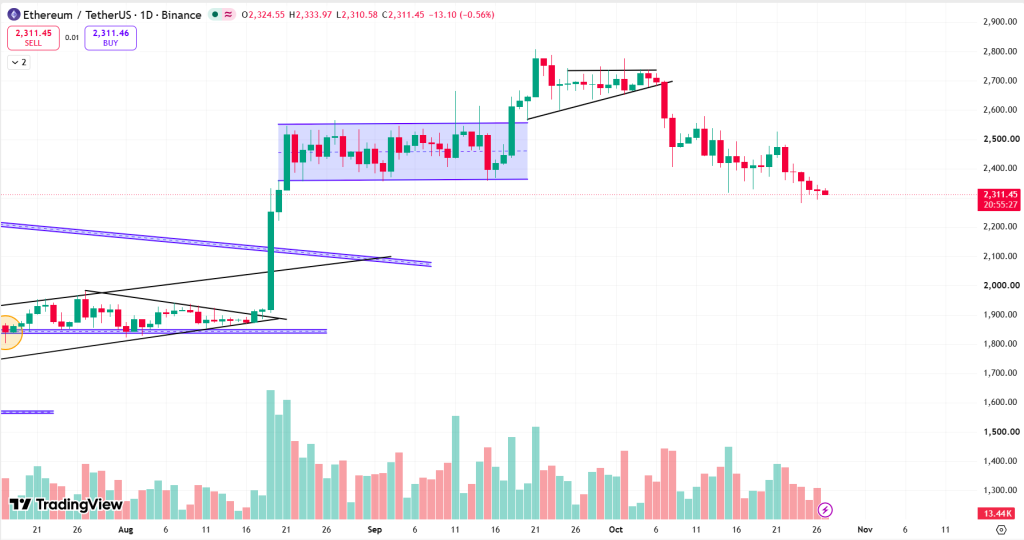
At the time of writing, ETH was trading at approximately $2,311.
| Support 2 | Support 1 | Asset | Resistance 1 | Resistance 2 |
| $2,200 | $2,300 | ETH | $2,550 | $2,700 |
In the grand scheme of things, ZebPay blogs are here to provide you with crypto wisdom. Get started today and join 6 million+ registered users to explore endless features on ZebPay!
Disclaimer:
Crypto products and NFTs are unregulated and can be highly risky. There may be no regulatory recourse for any loss from such transactions. Each investor must do his/her own research or seek independent advice if necessary before initiating any transactions in crypto products and NFTs. The views, thoughts, and opinions expressed in the article belong solely to the author, and not to ZebPay or the author’s employer or other groups or individuals. ZebPay shall not be held liable for any acts or omissions, or losses incurred by the investors. ZebPay has not received any compensation in cash or kind for the above article and the article is provided “as is”, with no guarantee of completeness, accuracy, timeliness or of the results obtained from the use of this information.



Be the first to comment