


Here is a technical analysis of ETH/USDT on a daily timeframe:
Market Overview
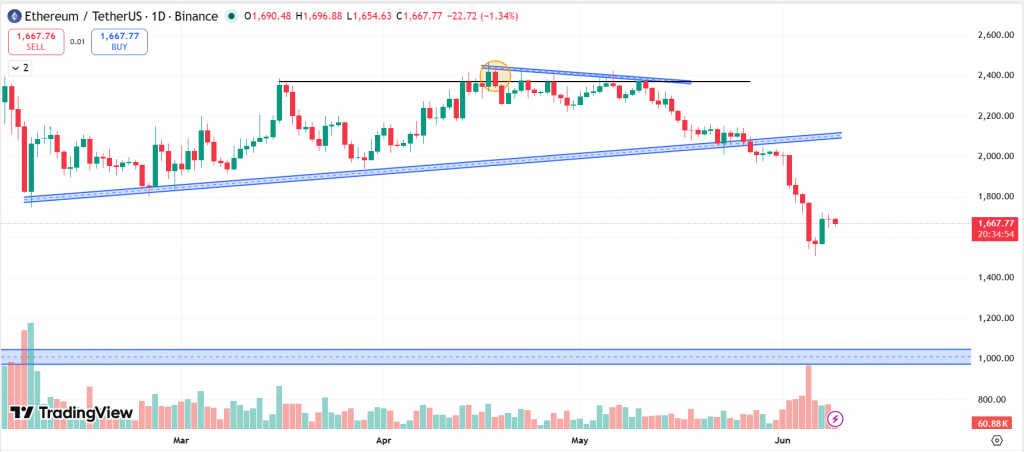
Ethereum (ETH/USDT) is currently trading around $1,668 on the daily timeframe after experiencing a sharp bearish breakdown below the key $2,000 psychological support level. The decline accelerated significantly during the first week of June, resulting in one of the strongest selloffs seen in recent months.
The breakdown confirms a continuation of the bearish trend that began after Ethereum lost its ascending trendline support in late May. What initially appeared to be a corrective pullback has now evolved into a deeper structural decline, with sellers maintaining firm control of the market. Price is currently attempting to stabilize near the $1,650–$1,700 region following an aggressive liquidation move that pushed ETH to its lowest levels since February.
Recent Price Action
Following last week’s report, Ethereum failed to reclaim the broken ascending trendline and remained trapped below the former support structure. Key developments include:

- Multiple failed recovery attempts below the $2,100 region, confirming persistent selling pressure.
- Prices continued forming lower highs and lower lows throughout early June.
- The major psychological support at $2,000 was decisively broken.
- Selling momentum accelerated sharply after the breakdown, resulting in a rapid decline toward the $1,550-$1,600 region.
- A strong bearish impulse candle, accompanied by elevated volume, signaled aggressive seller participation.
- The recent rebound remains relatively weak.
Also Read: Top 10 Layer-1 Blockchain Cryptos in June 2026
Current Structure and Trend
The overall market structure is considerably more bearish compared to the previous report. Key observations:
- The $2,000 psychological support has failed.
- Lower highs and lower lows continue to dominate price action.
- ETH remains well below major resistance levels.
- Sellers maintain control across the daily timeframe.
The current technical picture suggests:
- The market has transitioned from a bearish correction into a confirmed bearish trend.
- Any short-term recovery rallies may encounter selling pressure near previous support zones.
- The $1,650-$1,700 area is acting as the first stabilization zone following the recent selloff.
- A recovery above $1,800 would be required to improve short-term sentiment.
- Until then, downside risks remain elevated.
The former $2,000 support area has now become a significant resistance zone that buyers must eventually reclaim to shift momentum back in their favor.
Also Read: Top 10 dApp Tokens of June 2026
Volume and Momentum
Volume expanded noticeably during the recent breakdown, indicating stronger conviction behind the selloff compared to previous declines. Momentum indicators include:
- Increased selling volume during the break below $2,000.
- Strong bearish expansion candles confirming downside momentum.
- Limited buying follow-through following the initial bounce from recent lows.
- Continued dominance of sellers despite temporary stabilization.
For momentum to improve meaningfully, Ethereum would need to:
- Hold above the recent low near $1,550.
- Establish higher lows on the daily timeframe.
- Reclaim the $1,800 resistance area.
- Eventually recover above the former support zone around $2,000.
Until these conditions are met, bearish momentum remains the dominant market force.
At the time of writing, ETH was trading at approximately $1,668.
Summary
Ethereum is currently trading near $1,668 after suffering a decisive breakdown below the critical $2,000 support level. The bearish trend that began with the loss of the ascending trendline in late May has intensified, leading to a sharp decline toward the $1,550 region.
Although ETH has managed to stage a modest rebound from recent lows, the broader market structure remains firmly bearish. Sellers continue to control the daily timeframe, while former support zones have now turned into overhead resistance.
The immediate focus remains on whether buyers can defend the $1,550-$1,600 support region and build a meaningful recovery. Failure to stabilize above this area could expose Ethereum to further downside pressure, while a sustained move back above $1,800 would be the first indication that bearish momentum is beginning to weaken.
Support and Resistance Levels
| Support 2 | Support 1 | Asset | Resistance 1 | Resistance 2 |
| $1,500 | $1,600 | ETH | $1,800 | $2,000 |
In the grand scheme of things, ZebPay blogs are here to provide you with crypto wisdom. Get started today and join 6 million+ registered users to explore endless features on ZebPay!
Disclaimer:
Crypto products and NFTs are unregulated and can be highly risky. There may be no regulatory recourse for any loss from such transactions. Each investor must do his/her own research or seek independent advice if necessary before initiating any transactions in crypto products and NFTs. The views, thoughts, and opinions expressed in the article belong solely to the author, and not to ZebPay or the author’s employer or other groups or individuals. ZebPay shall not be held liable for any acts or omissions, or losses incurred by the investors. ZebPay has not received any compensation in cash or kind for the above article and the article is provided “as is”, with no guarantee of completeness, accuracy, timeliness or of the results obtained from the use of this information.

Be the first to comment