




TLDR
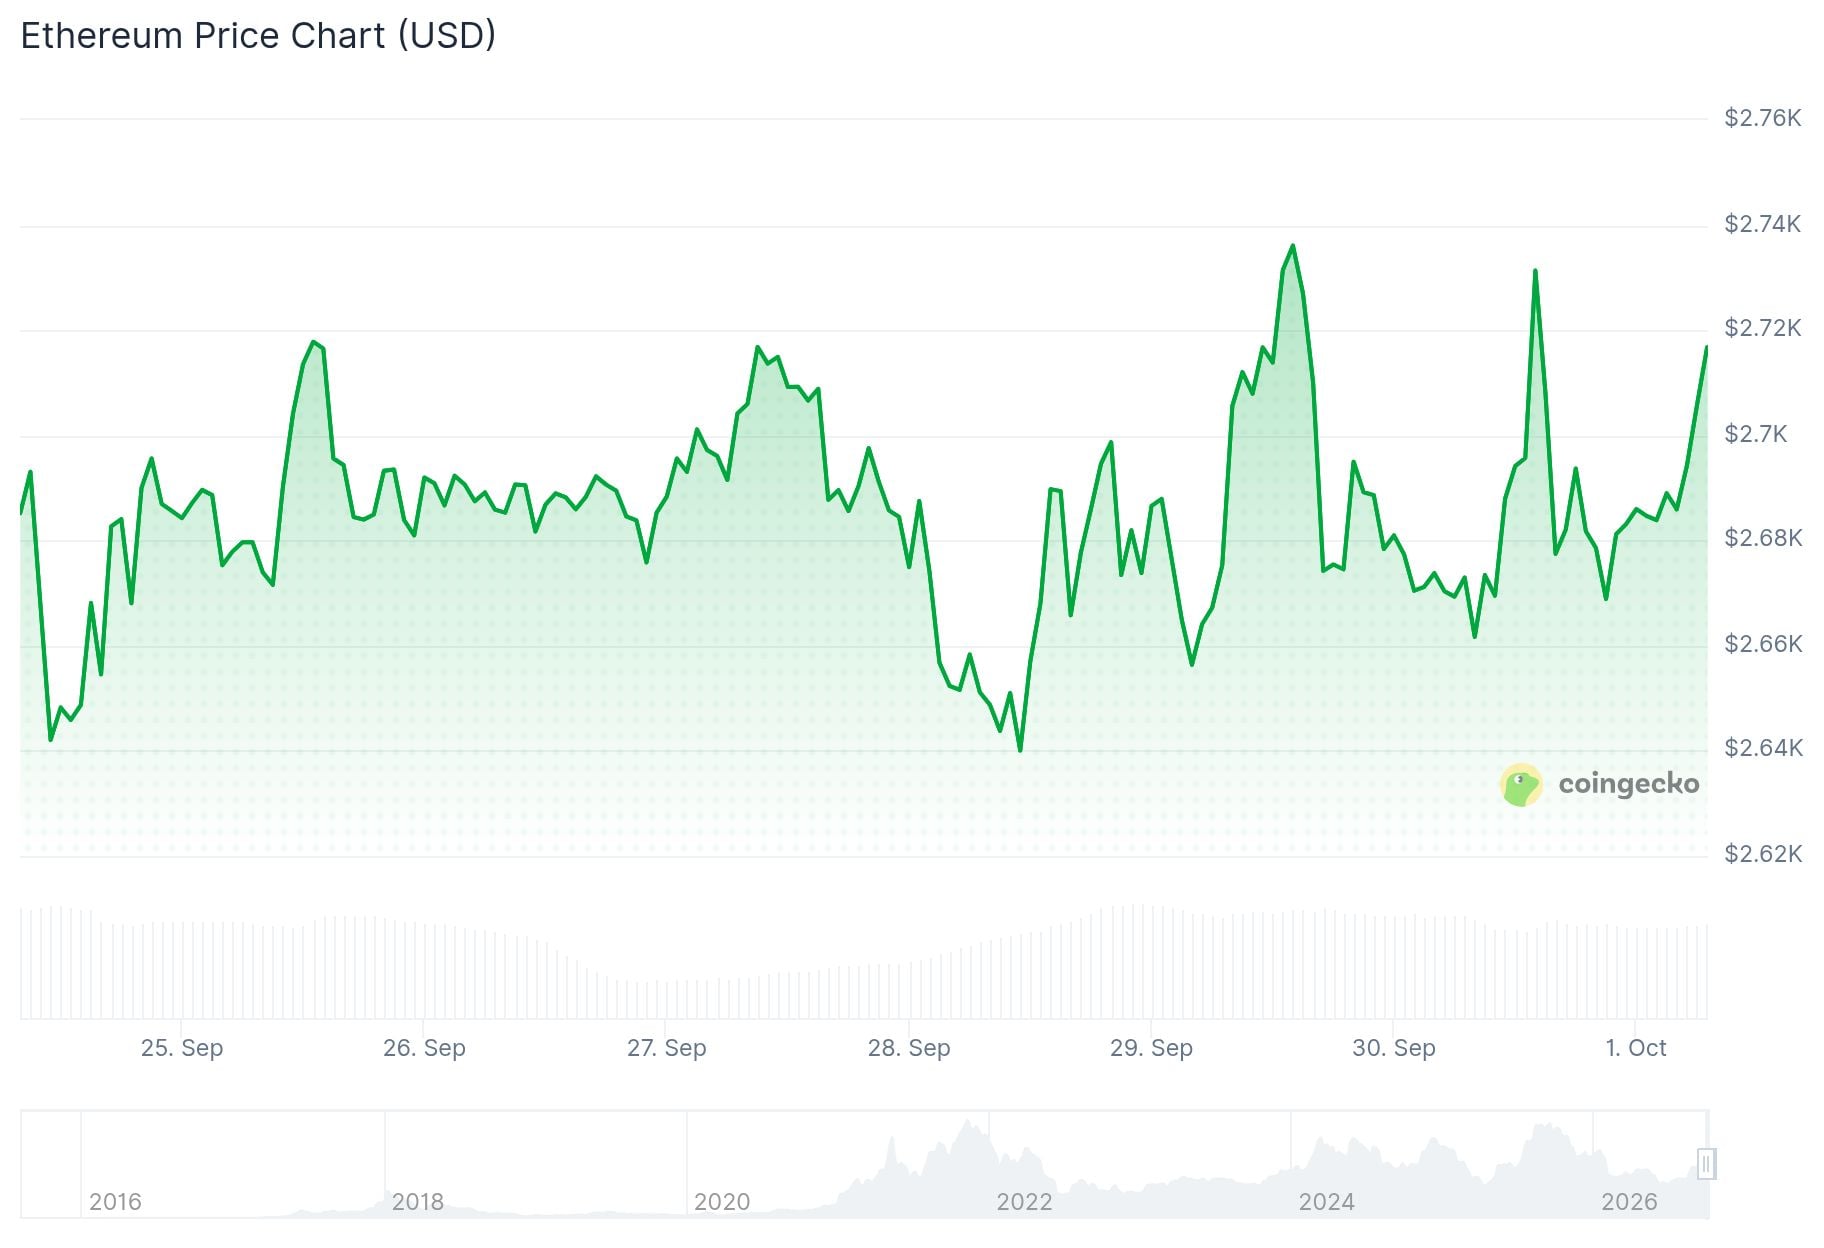
- Ethereum rose above $2,700 on September 30 before slipping back to around $2,679.
- US PCE inflation for August came in at 3.4%, below the 3.7% forecast.
- Fed rate hike odds for the October meeting dropped from 67% to 34%.
- Ethereum ETFs saw $2.81 million in outflows on September 29, ending a seven-day inflow streak.
- ETH holds above its 200-day EMA at $2,462 and is testing resistance at $2,816.
Ethereum climbed above $2,700 on September 30 after new US inflation data came in softer than expected. The gain did not hold, and the price slipped back to $2,679.
The move followed the release of the Personal Consumption Expenditures (PCE) index, the Federal Reserve’s preferred inflation gauge. The reading for August came in at 3.4%, below the forecast of 3.7%.
Core PCE also came in lower than expected, falling 10 basis points short of analyst predictions. The data suggests inflation is cooling, even though it remains above the Fed’s 2% target.
Fed Rate Hike Odds Fall Sharply
The softer inflation print changed expectations for the Federal Reserve’s next move. According to the CME FedWatch Tool, the odds of a 25 basis point rate hike at the October 28 meeting fell from 67% to 34%.
BREAKING: 🇺🇸 Fed rate hike odds have dropped from 70% to 34%.
There’s now a much lower chance of another rate hike this year, which is absolutely bullish for markets. pic.twitter.com/sO8GvijaHM
— Ash Crypto (@AshCrypto) September 30, 2026
Lower odds of a rate hike are generally seen as positive for risk assets like Ethereum. Analyst Alejandro Arrieche of FXEmpire noted that most traders no longer expect a hike at the next FOMC meeting.
Not every voice framed the moment the same way. Analyst Ash Crypto wrote on X that $ETH posted its highest monthly close of 2026 and its best third quarter in Ethereum’s history, calling the result “absolutely massive.”

$ETH gave its highest monthly close in 2026 and best Q3 in Ethereum’s history.
This is absolutely massive. pic.twitter.com/bgHtbQMLxQ
— Ash Crypto (@AshCrypto) October 1, 2026
That comment came as trading volumes and on-chain data pointed to renewed buying interest. Santiment data shows Ethereum’s MVRV ratio crossed above zero for the first time since July 2025, a level that has preceded past rallies.
ETF Flows Show a Mixed Picture
Ethereum ETFs recorded $2.81 million in outflows on September 29. This ended a seven-day streak of inflows and marked the first outflow day since September 18.
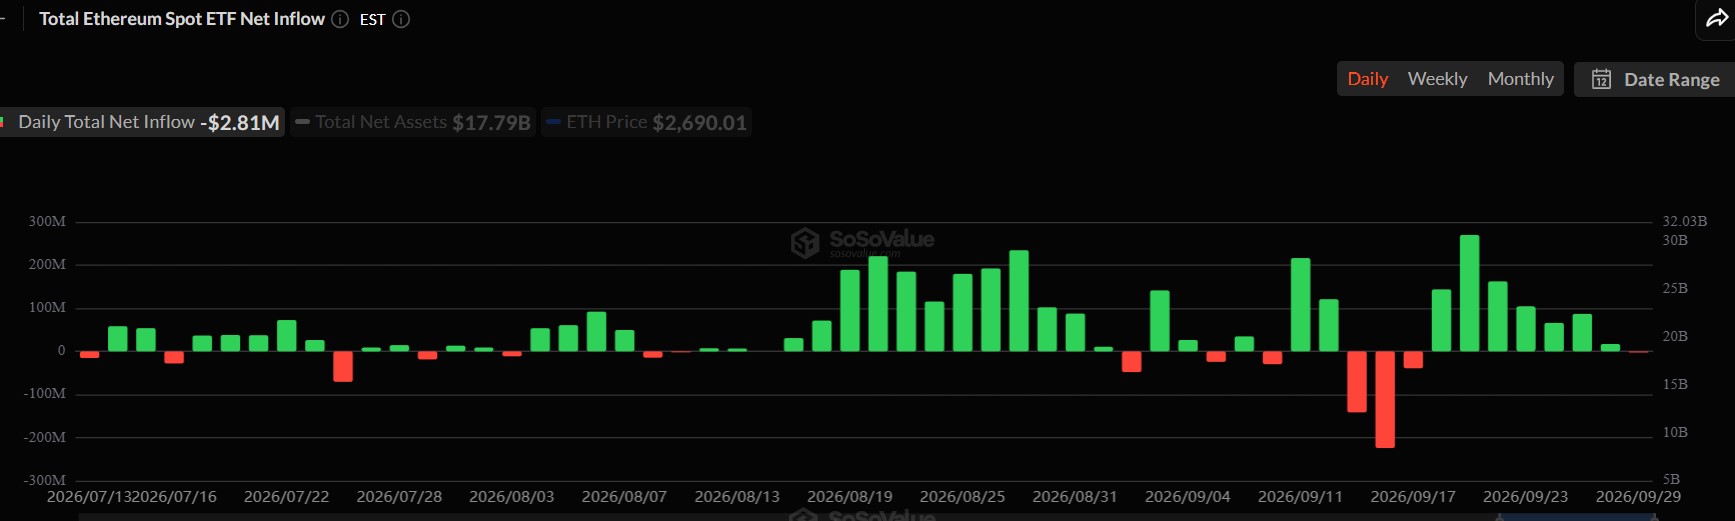
Ethereum was the only crypto ETF category to post outflows that day. Despite the single-day reversal, Ethereum ETFs have still brought in $892 million during September, the third straight month of net inflows.
On the charts, Ethereum is holding above its 200-day exponential moving average (EMA), currently at $2,462. Analysts view this level as a dividing line between a bullish and bearish long-term trend.
The next hurdle for ETH sits at $2,816. A close above that level could open the path toward the $3,000 mark, according to technical analysis from CoinGape.
Momentum indicators, including the Awesome Oscillator, show green and growing bars. This pattern typically favors continued upward price movement.
Some analysts point to a possible pullback first. FXEmpire’s analysis suggests ETH may dip toward $2,400 to $2,500 before resuming its climb, mirroring a pattern seen in 2025 after the Pectra network upgrade.
That upgrade pattern is being compared to the upcoming Glamsterdam upgrade, expected in the fourth quarter of 2026. Developers see it as a similar technical catalyst for the network.
If the current trend holds and liquidity returns, some forecasts place Ethereum’s next target between $3,000 and $3,400 over the coming four to eight weeks.
As of October 1, Ethereum was trading at $2,711.54, up 1.49% on the day.



Be the first to comment