


Ethereum’s latest price crash has pushed the cryptocurrency below $1,800, placing its monthly chart under pressure at a time when the entire crypto market sentiment has turned heavily bearish. There is also another weakness coming from the monthly RSI, which has now dropped to its lowest level since the asset launched in 2015.
That reading has made the current setup very important, as previous deep RSI resets appeared near major Ethereum cycle lows in 2020 and 2022, and there’s also a question of whether the same pattern is forming again.
Related Reading
RSI Hits Its Lowest Level Since Ethereum’s Launch
Ethereum has endured a brutal nine months since it peaked at $4,946 in August 2025. The brutal price action has culminated in a break below $1,800 in June, with the leading altcoin falling to as low as $1,536 in the past 24 hours, which is its lowest price level so far in 2026.

Interestingly, that crash has caused the monthly Relative Strength Index (RSI) on ETH/USD to print its lowest reading since Ethereum’s launch in 2015. The monthly RSI indicator chart shows the index dropping to around 40, its lowest level on the monthly timeframe since ETH began trading in 2015.
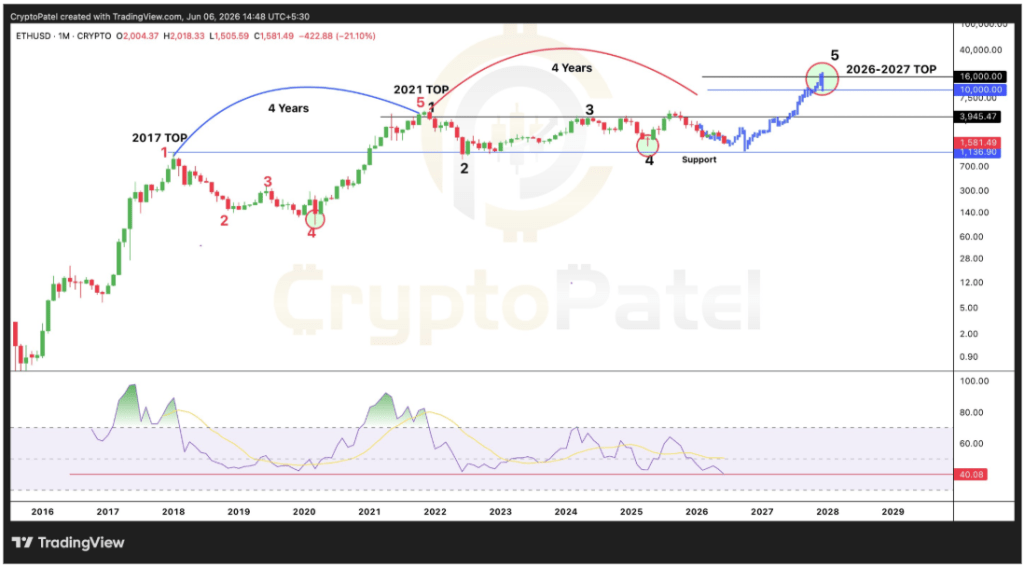
Ethereum Price Chart. Source: @CryptoPatel On X
What Does This Mean For Ethereum?
Back in 2020, Ethereum’s RSI reached a depressed level before ETH began a massive rally from around $88 to its 2021 peak above $4,800. Again in 2022, another deep RSI reset came before ETH eventually rallied from around $880 to its 2025 all-time high.
The current setup is not a guarantee that these same rallies will repeat, but it does show that Ethereum is now in the type of momentum zone that has always appeared closer to major bottoms than cycle tops.
A notable difference this time is that the RSI has gone even lower, making the 2026 reading the most extreme in the cryptocurrency’s history. If history repeats itself, the ensuing rally might be even larger than those seen in the previous cycles.
Technical analysis of the monthly candlestick timeframe presents Ethereum as moving through another four-year cycle, similar to the move from the 2017 top to the 2021 top. As shown in the chart image above, the 2017 cycle peak is the first major top, the 2021 peak is the next major cycle high, and then there is a projection of a possible top around $10,000 sometime in 2026-2027.
Related Reading
At the time of writing, Ethereum is trading at $1,612, leaving bulls with the immediate task of defending the $1,600 region with stronger inflows. Speaking of inflows, Spot Ethereum ETFs ended a 17-day streak of outflows on Thursday, June 4, after recording $19 million in net inflows. However, that relief was short-lived, as Friday’s session returned to negative territory with $5.97 million in net outflows.
Featured image from Unsplash, chart from TradingView


Be the first to comment