


ETHFI price surged more than 13% on Sep. 10, breaking above a months-long range as momentum strengthened across its daily and 4-hour charts.
Summary
- ETHFI price rose 13.68% to $0.7032 after reaching an intraday high of $0.7232.
- The token broke above its $0.6571 upper Bollinger Band, showing strong buying pressure.
- 4-hour Supertrend support climbed to $0.6075 as Chaikin Money Flow reached 0.32.
- Analyst Sebi said buyers must hold the breakout and form a higher low for confirmation.
ETHFI price breaks above its recent range
Ether.fi (ETHFI) price traded near $0.7032 at the time of writing, up 13.68% from an opening price of $0.6186. The token moved between $0.6000 and $0.7232 during the session, with the wide range showing a sharp rise in volatility.

The rally carried ETHFI above the local high near $0.65 established in late August. Price had consolidated mostly between $0.53 and $0.62 after that earlier advance, but the latest daily candle broke through the top of that range.
ETHFI also moved further away from its June low near $0.28. The token has now gained about 150% from that level, although it remains below the prices recorded during late 2025 and early 2026.
The advance continued into the U.S. afternoon on Sep. 10, with the daily chart captured shortly after 4 p.m. Eastern time. ETHFI remained above $0.70, but the open daily candle meant the final closing level had not yet been set.
Market analyst Sebi described the move as ETHFI’s first serious attempt to leave its 2026 base. He said confirmation would depend on the final size of the daily candle and whether buyers can hold the breakout instead of giving back the advance.
Momentum indicators favor ETHFI buyers
The daily Bollinger Bands show ETHFI trading above the upper band at $0.6571. The 20-day middle band stands at $0.5817, while the lower band is near $0.5063.
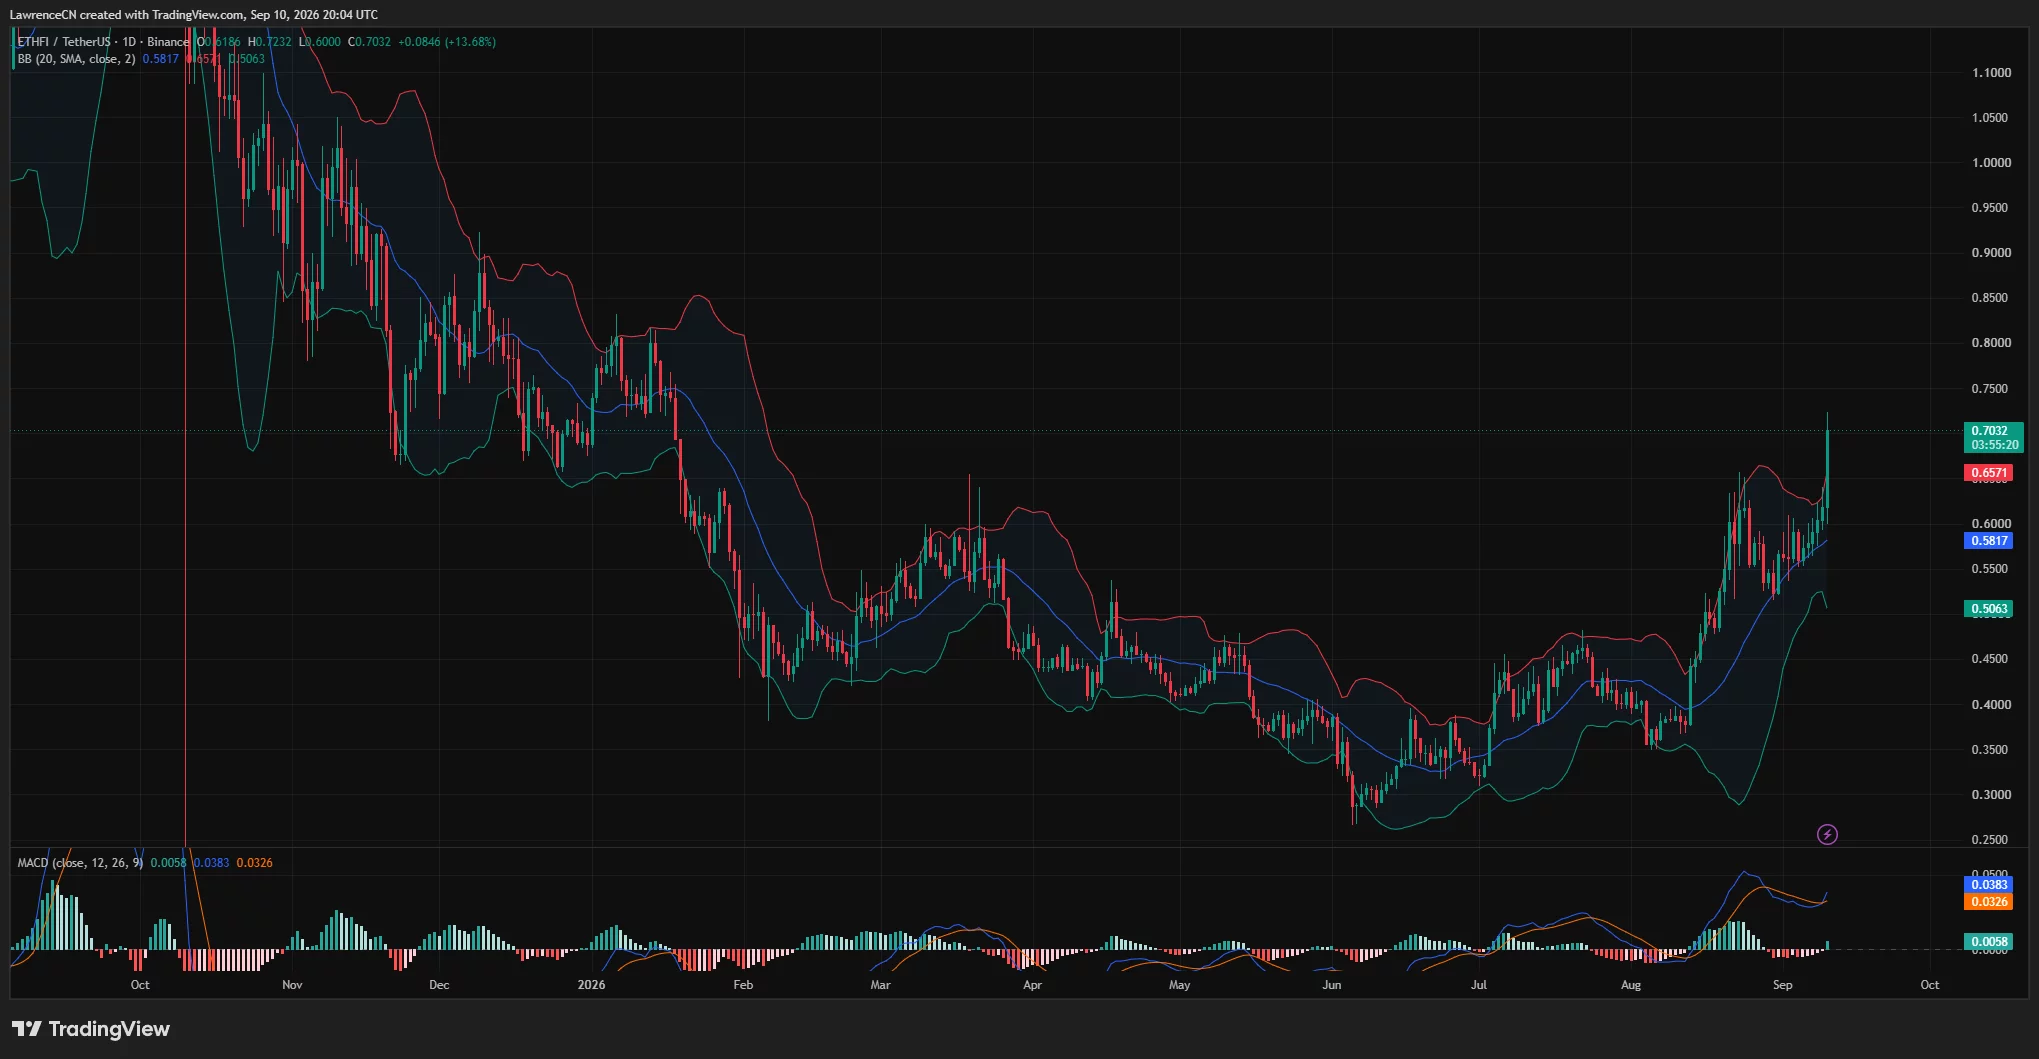
A move beyond the upper band reflects strong momentum, but it can also mean that price has become extended over the short term. ETHFI could therefore consolidate or retest the breakout area before making another sustained advance.
The daily MACD supports the bullish setup. The MACD line stands at 0.0383, above the signal line at 0.0326, while the positive histogram has increased to 0.0058. The readings show that upward momentum strengthened after weakening at the start of September.
The 4-hour chart provides further confirmation. ETHFI remains above its Supertrend indicator, which has moved up to approximately $0.6075 and continues to signal an active upward trend.
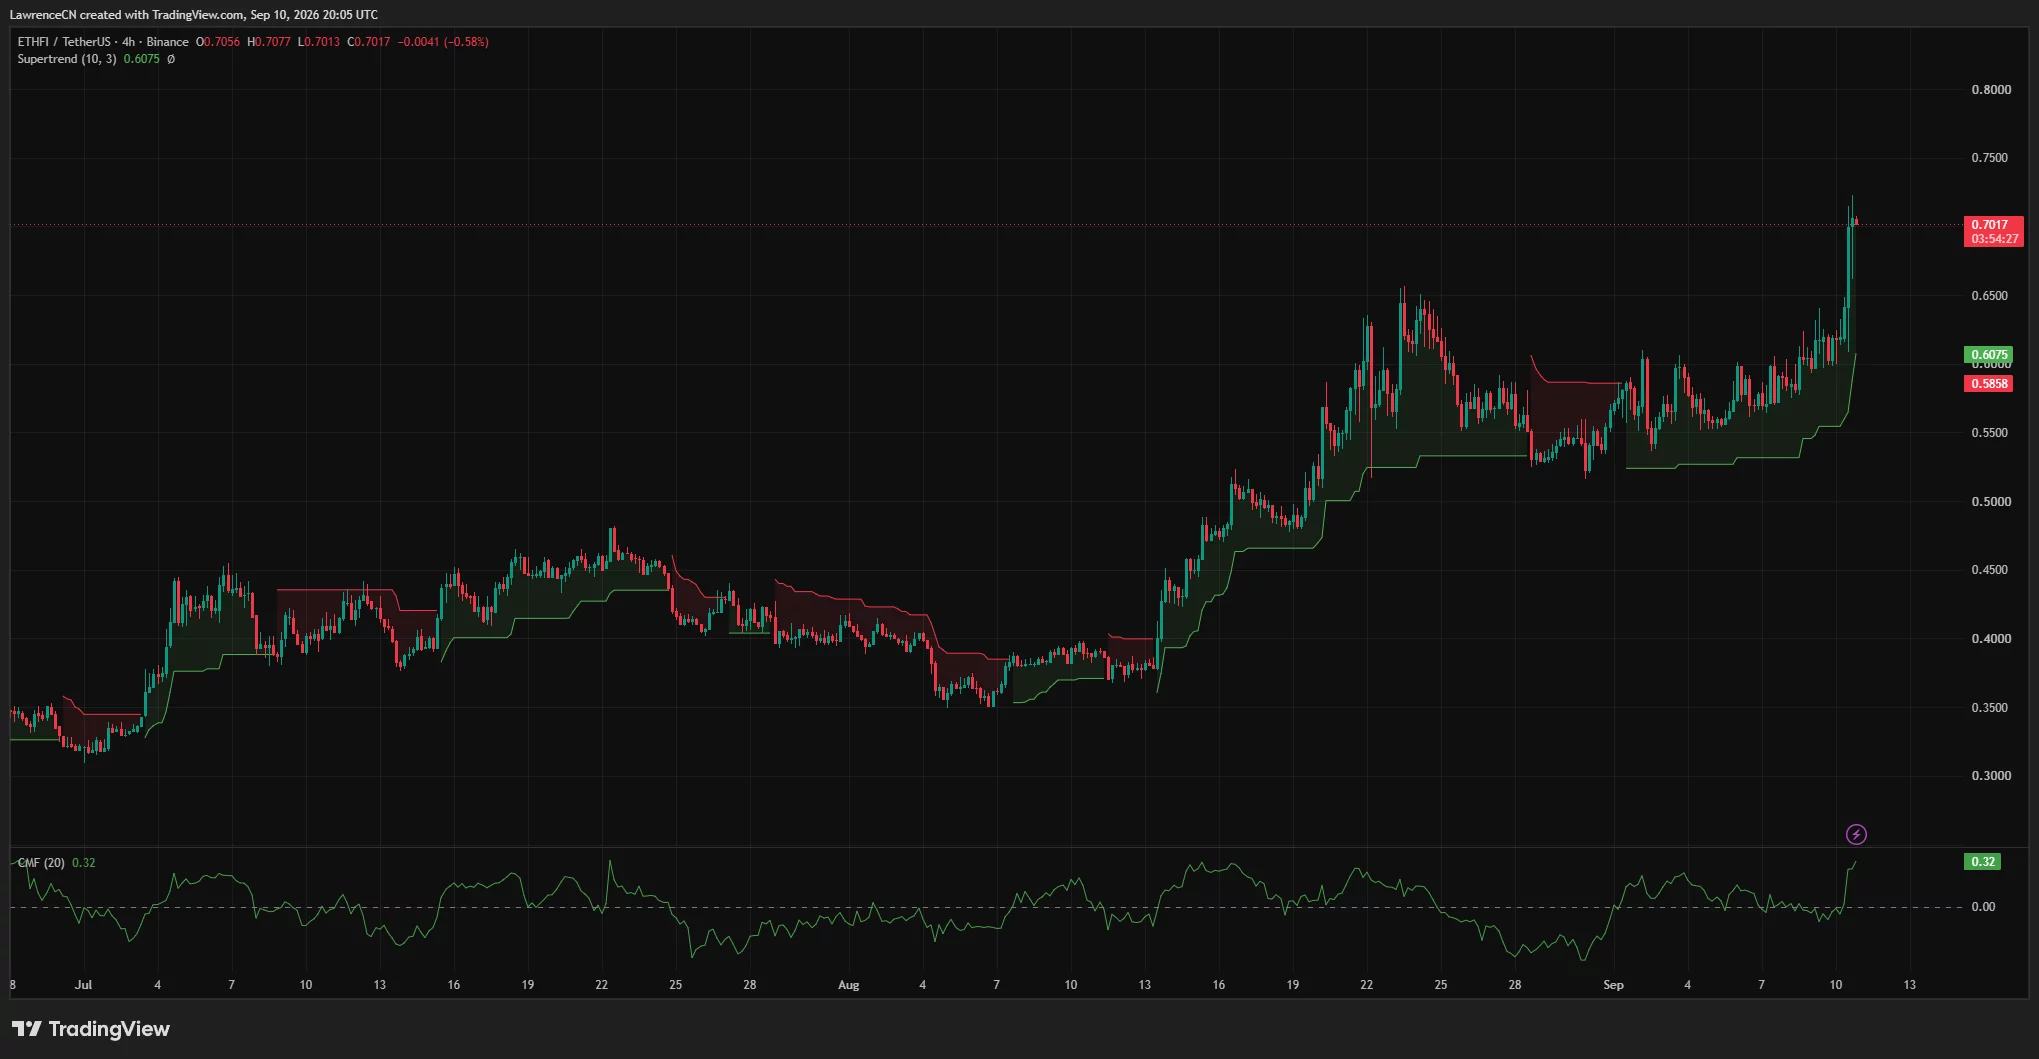
Chaikin Money Flow on the 4-hour timeframe has climbed to 0.32. A reading above zero indicates that buying pressure has exceeded selling pressure during the indicator’s measurement period, while the jump toward 0.32 shows stronger capital inflows during the breakout.
ETHFI support rises toward $0.65
The first level to watch is the daily upper Bollinger Band near $0.6571. A pullback that holds this area would keep ETHFI above the former range and could allow buyers to form the higher low identified by Sebi.
Below $0.6571, the 4-hour Supertrend level at $0.6075 forms the next support. The psychological $0.60 mark sits nearby, making the $0.60–$0.61 region an important short-term test if selling pressure increases.
The daily Bollinger Band midpoint at $0.5817 offers deeper support. A close below that level would place ETHFI back inside its earlier range and weaken the breakout structure. The lower band at $0.5063 would become relevant if the token loses both $0.60 and $0.58.
On the upside, the intraday high at $0.7232 is the immediate resistance. A confirmed break above it could expose $0.75, followed by the $0.80 area last traded around January.
The wider daily chart still shows heavy overhead resistance. Sebi identified $1.72 to $1.95 as the major daily supply zone, although ETHFI would need to more than double from its current price before testing that range.
Ether.fi growth supports the market narrative
Sebi linked the technical breakout to Ether.fi’s expansion beyond its original liquid restaking service. According to figures shared by the analyst, the protocol holds approximately $4.87 billion in total value locked, compared with ETHFI’s market capitalization of roughly $677 million.
He also reported that Ether.fi generated $13.66 million in fees and $3.46 million in protocol revenue during the previous 30 days. The platform’s August update recorded more than 500,000 members and an annualized transaction run rate of $2 billion for its non-custodial crypto banking product, according to the analyst.
However, Sebi identified token value capture as a remaining weakness. He said growth in protocol activity does not automatically create demand for ETHFI and placed 30-day holder revenue at zero.
The charts therefore leave ETHFI at a key point. Momentum favors buyers above $0.65, but the token must hold the breakout and establish support above $0.60–$0.61 to reduce the risk of a return to its previous range.
Disclosure: This article does not represent investment advice. The content and materials featured on this page are for educational purposes only.



Be the first to comment