


What to know:
- WIF is trading near $0.197 as rally fades, shifting from bullish momentum to consolidation.
- A falling wedge pattern suggests a possible bullish breakout if resistance is confirmed in upcoming sessions.
- The RSI at 45.07 and a MACD bearish crossover indicate growing downside pressure and weakening momentum.
Dogwifhat (WIF) shows potential for a bullish rally following the weeks in consolidation in a falling wedge pattern. However, technical indicators signal weakening momentum for the WIF price with bearish shifts in trend strength.
Derivatives data reflects mixed participation, with slightly rising open interest but declining trading activity, suggesting cautious market engagement. According to CoinMarketCap, WIF is trading at $0.1972 with a daily decline of 1.36%.

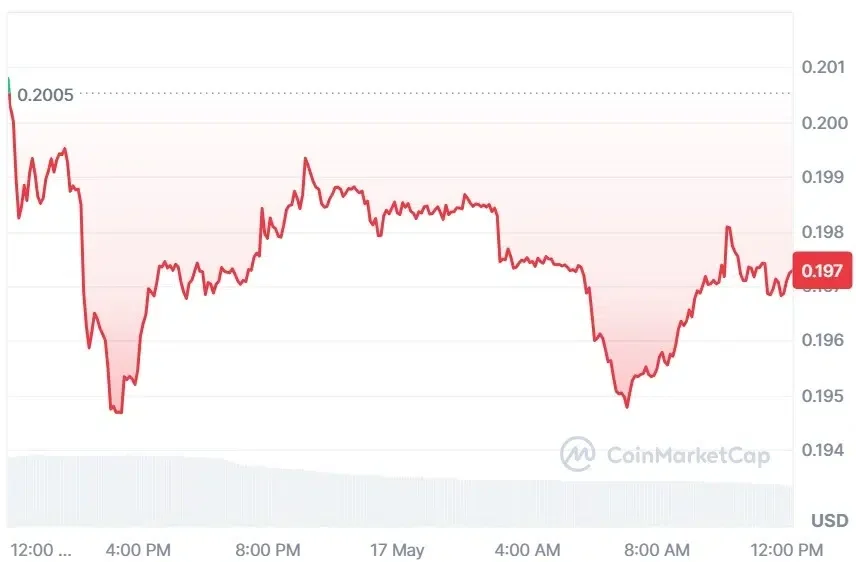
Source: CoinMarketCap

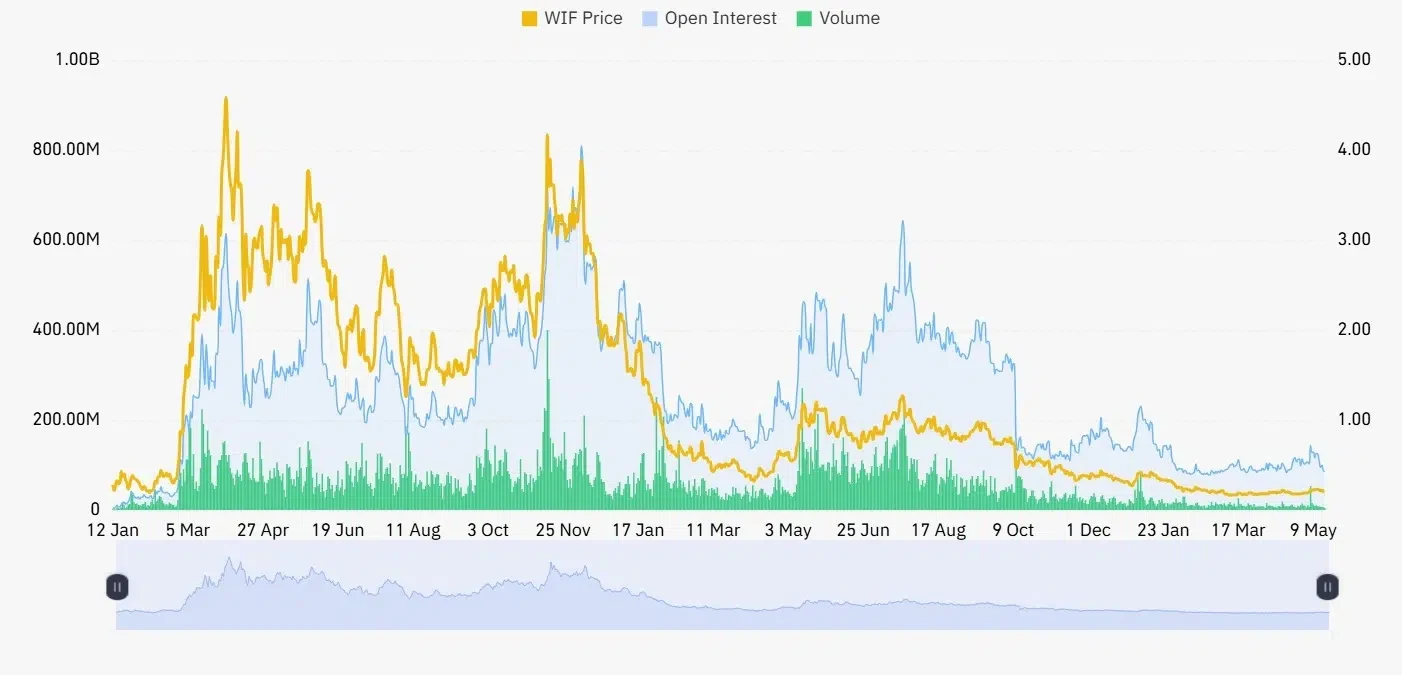
WIF Derivative Data Point to Mixed Outlook
According to Coinglass, the WIF open interest increased by 1.20%, reaching $85.27 million, indicating a slight rise in active contracts and trader participation, suggesting improving market engagement and potentially stronger positioning or renewed confidence in derivatives markets despite short-term fluctuations and ongoing volatility in trading conditions.

Source: Coiglass
However, volume declined by 25.97%, reaching $67.83 million, reflecting reduced trading activity and weaker participation compared to prior levels, possibly driven by lower volatility, cautious sentiment, or a temporary market slowdown in derivatives trading conditions.
Also Read: Dogwifhat (WIF) Nears Key Support: Is a $1.35 Reversal Coming?
WIF Price Setup Hints at a Bullish Move Toward $1.30
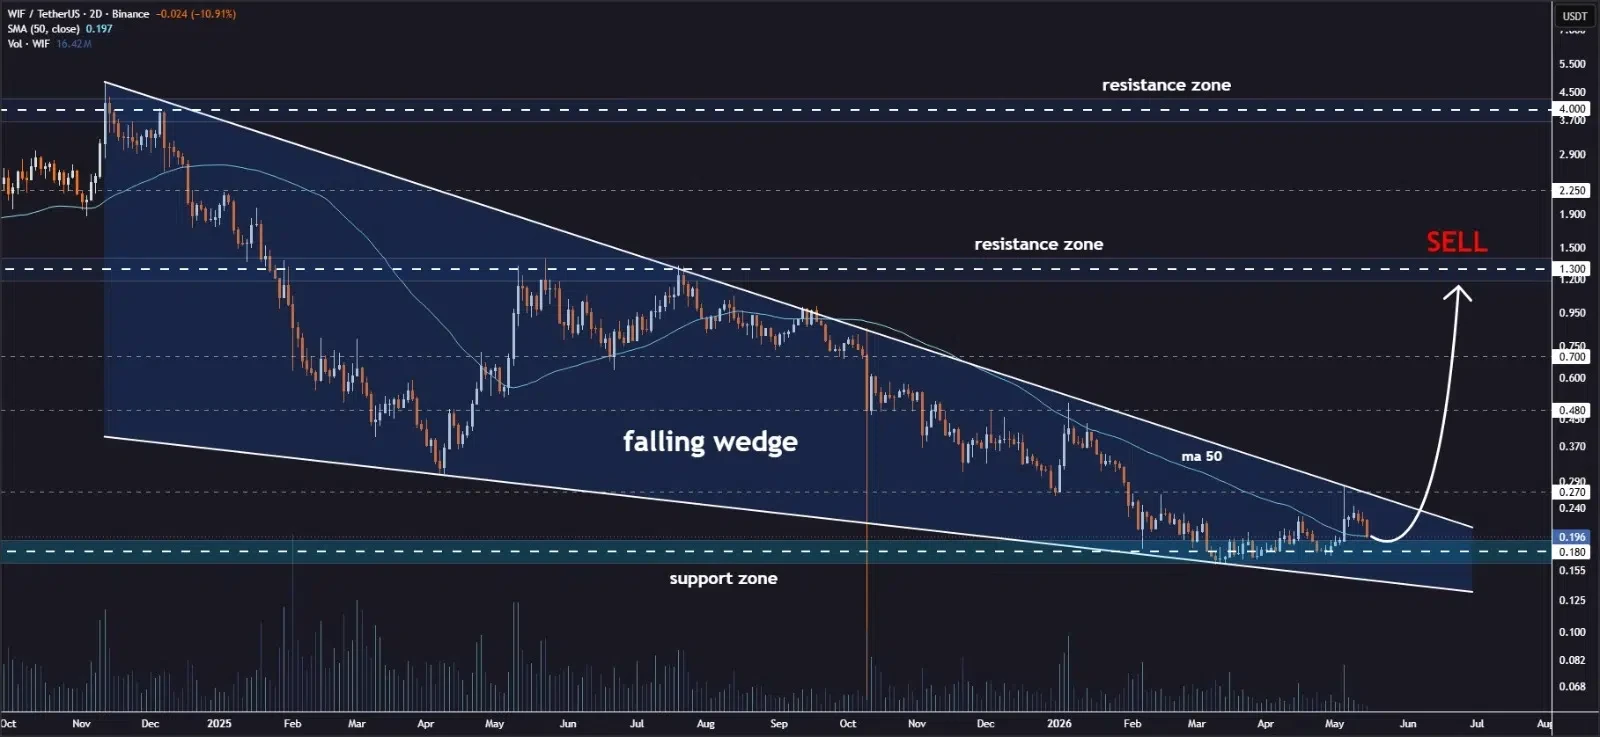
Furthermore, the crypto analyst Jonathan Carter pointed out that WIF has formed a falling wedge in its 2-day chart, a formation known to be a sign of weakening sellers and a potential bullish trend change.
The WIF price has been compressing as it consolidates for several weeks, and the trading volume starts rising, indicating increasing trader participation. Traders will wait for a breakout from above the resistance trendlines in coming sessions.

Source: Jonathan Carter’s X Post
Experts are now looking for a breakout trigger that would help breach the resistance level of the wedge pattern, thus paving the path for a rally. If the momentum increases, the potential targets for the WIF price will be around $0.27, $0.36, $0.48, $0.70, and $1.30.
However, there is a possibility that the trend may become invalid due to a sudden failure in sustaining the support level and market sentiment.
WIF Technical Indicators Point to Downward Pressure
According to TradingView, the WIF price has made a double bottom pattern between March and April, causing a strong bullish trend up to around 0.26000 by early May.
From that time, the WIF price has moved into a correction, and several bearish candles have caused a downward movement of the price to around 0.19700.
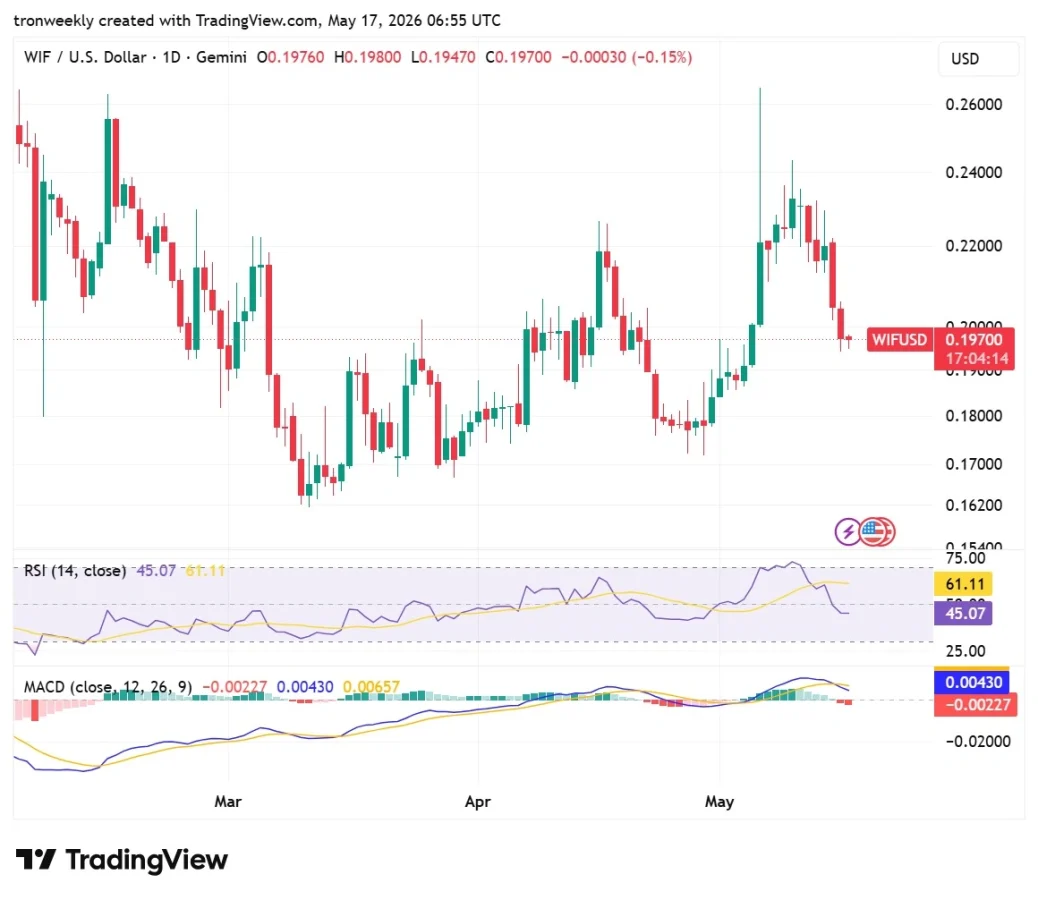
Source: TradingView
The technical indicators have proved that there is an immediate change in the momentum of the market.
This is evident by the fact that the RSI has dropped to 45.07 and has crossed its moving average, indicating that there is selling pressure in the market. At the same time, the MACD indicator has shown a bearish crossover.
This article contains market analysis and price predictions. These are not guarantees. Crypto markets are volatile. Always DYOR. Not financial advice.
Also Read: Dogwifhat (WIF) Shows Strength After Downtrend; Bulls Target $1.35 Level

Be the first to comment