


What to know:
- SAND is forming a falling wedge, a bullish reversal setup, with potential upside to $1.45 if support near $0.070 holds.
- Price stays below all major EMAs (20, 50, 100, 200), while RSI at 38.95 shows bearish momentum but not oversold.
- A 111.74% surge in volume and slight rise in open interest suggest growing participation and possible accumulation.

The Sandbox (SAND) is trading in a falling wedge with weakening bearish momentum and rising activity; despite a strong downtrend below key moving averages and weak RSI, increased volume and stable open interest suggest accumulation, leaving potential for a bullish breakout for the SAND price if support holds.
At the time of writing, SAND is trading at $0.07043 with a 24-hour trading volume of $37.35 million and a market capitalization of $206.65 million. Despite posting a 3.17% decline over the last 24 hours, rising trading volume and easing pressure point to a breakout in the coming sessions.

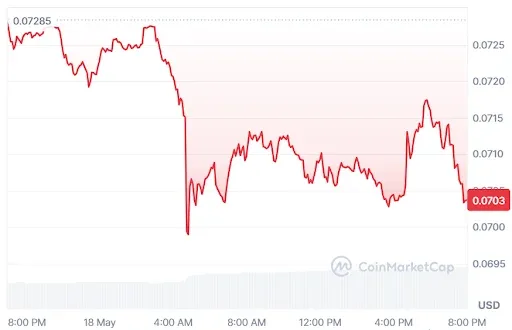
Source: CoinMarketCap

SAND Price Could Surge to $1.45 If Support Holds Strong
According to crypto analyst Jonathan Carter, the SAND price is showing a notable technical structure on the weekly chart, with the price respecting a long-standing falling wedge pattern.
After extended downside pressure, the SAND price is repeatedly finding support at the lower boundary, suggesting weakening bearish momentum and gradual accumulation. Buyers are beginning to stabilize price action within this key zone.

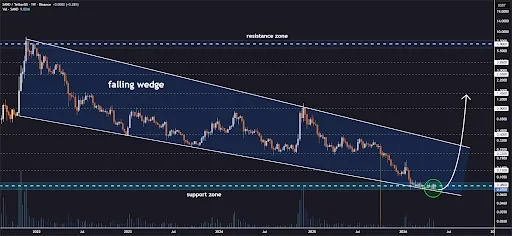
Source: Jonathan Carter’s X Post
In case the pattern remains intact, a bullish breakout could emerge, pointing toward the possibility of a recovery in the near future.
The SAND price objectives include $0.13, $0.22, $0.40, $0.90, and $1.45, depending on how much momentum will be demonstrated by the market. However, in case of failure of support level for the wedge pattern, the whole idea would become invalid.
Also Read: The Sandbox (SAND) Accumulation Could Drive The Price Toward $0.085
Technical Indicators Point to Bearish Dominance
According to TradingView, the SAND price is on a strong downward trend, continuously forming lower tops and bottoms.
Its price is trading well below its 20-day, 50-day, 100-day, and 200-day EMAs, thus making a perfect example of a bearish crossover pattern. Currently, the asset is heading towards support at $0.07060.

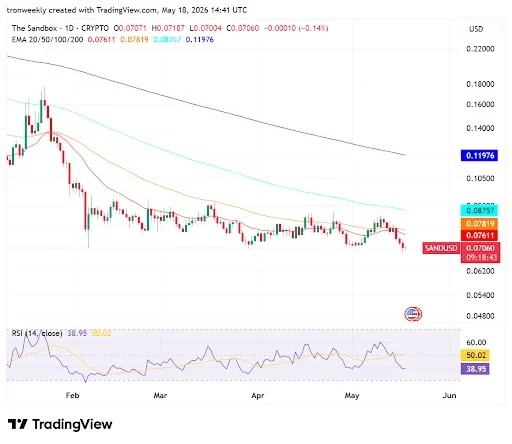
Source: TradingView
The relative strength index is standing at 38.95, moving below its yellow signal line of 50.02. It is indicative of bearish sentiment that has not yet reached oversold conditions.
In addition, the short-term EMAs are hugging each other near the top, providing solid overhead resistance that does not allow even the briefest of rallies to occur.
SAND Derivative Data Point to Improving Strength
However, the trading volume went up to $36.60 million, an increase of 111.74%, which is indicative of active participation in the market by traders due to changes in prices and general sentiment prevailing in the market.
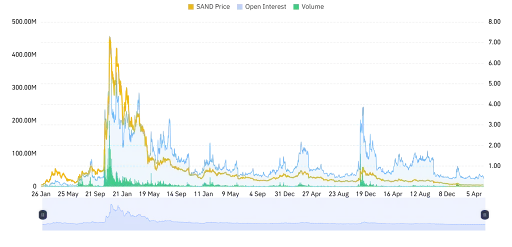

Source: Coinglass
The open interest increased slightly by 1.09% to stand at $26.46 million. The slight increase reflects consistency in the positions held by market players despite the fluctuations in trading volumes and expectations.
This article contains market analysis and price predictions. These are not guarantees. Crypto markets are volatile. Always DYOR. Not financial advice.
Also Read: SAND Price Forecast: Break Above Resistance Could Trigger Move to $0.65

Be the first to comment