


What to know:
- Polkadot (DOT) tests falling wedge support, signaling weakening bearish momentum and potential breakout.
- DOT remains in consolidation with neutral RSI (50.62) and MACD, showing market indecision.
- Analysts see breakout targets from $1.75 to $15.50 if support holds and volume confirms.

Polkadot (DOT) is testing support within a falling wedge, suggesting weakening bearish momentum and possible accumulation for the DOT price. Indicators remain neutral, showing consolidation and no clear trend. Rising trading activity contrasts with lower positioning. A confirmed breakout with strong momentum is needed for a potential bullish reversal.
At the time of writing, DOT is trading at $1.28 with a 24-hour trading volume of $176.34 million and a market capitalization of $2.16 billion. Despite the signs of stability over the last 24 hours, the DOT price structure points to a strong breakout ahead.

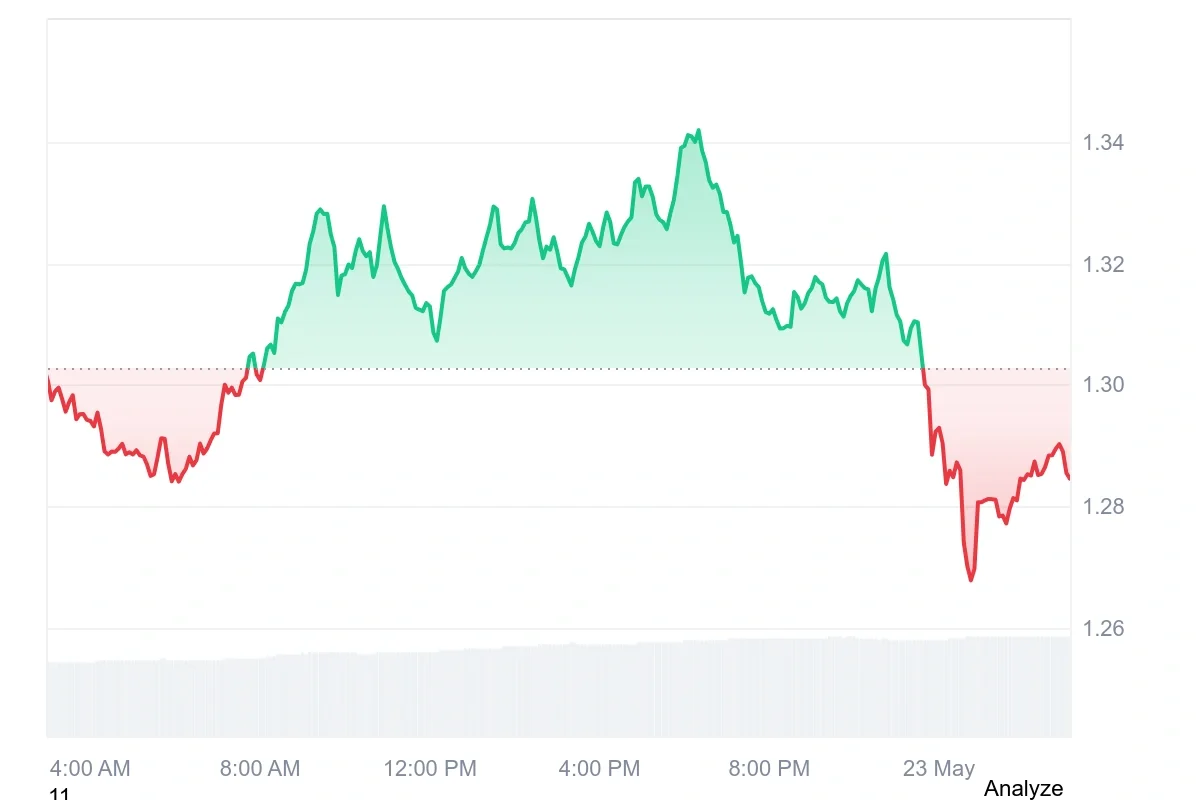
Source: CoinMarketCap

DOT Price Eyes $15.50 Amid Falling Wedge Formation
Furthermore, the crypto analyst Jonathan Carter highlighted that the DOT price is approaching a critical technical zone as it tests the lower boundary of a falling wedge on the weekly chart.
The pattern reflects tightening price action and weakening bearish momentum, often viewed as a potential accumulation phase where selling pressure gradually fades and buyers begin to regain control near key support levels.

Source: Jonathan carter’s X Post
If the support is maintained and validation is confirmed, a bullish pattern may emerge for the DOT price, potentially leading to a rally in the middle of the year.
The upside targets for the DOT price include the levels of $1.75, $3.00, $4.30, $7.00, $10.50, and $15.50. But without a breakout accompanied by significant volumes, such a move may just range or even decline.
Also Read: Polkadot (DOT) Price Forecast: Bulls Aim for $1.40 After Recent Pullback
Momentum Indicators Point to a Neutral Outlook
The RSI has moved to a level of neutrality at 50.62. This suggests an equal amount of buying and selling activity. Rising above the previous lows recorded in May, the RSI indicator moves slightly lower than the signal line, which is set at 51.90.
This simply means that there is some pressure for downward movement, although not enough for an upward break-out for the DOT price.

Source: TradingView
On the other hand, the MACD suggests a low-volatility consolidation. The MACD is held very close to -0.00267 by the signal line, which stands at -0.00538.
Moreover, the MACD’s histogram consists of decreasing red bars around the zero mark. Such an indication shows an absence of any directional movement in the market trend.
Rising Trading Volume Could Lead to a Breakout
However, the DOT trading volume increased by 22.23%, amounting to $291.64 million, which is an indication of an increase in trading activities and greater involvement in the markets compared to before.


Source: Coinglass
The open interest decreased by 8.82% to reach $193.28 million. The decrease shows that traders are decreasing their bets and exiting the game because they have either made their profits or due to caution arising in the derivatives market.
This article contains market analysis and price predictions. These are not guarantees. Crypto markets are volatile. Always DYOR. Not financial advice.
Also Read: Polkadot (DOT) price gains momentum as recovery trend strengthens toward $3

Be the first to comment