


What to know:
- Fetch.ai (FET) is consolidating above key support, signaling a possible recovery and breakout toward the $1.80 target zone.
- The RSI climbs to 52, and the MACD flattens near neutral levels, suggesting bearish momentum is fading.
- Buyers are defending channel support, and a breakout above resistance could trigger stronger bullish momentum.

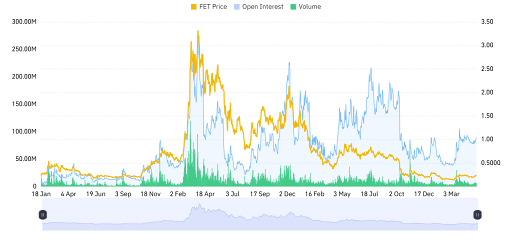
Fetch.ai (FET) is consolidating after defending key channel support and forming higher lows, signaling potential recovery for the FET price. RSI and MACD indicate fading bearish momentum and growing neutrality, while declining open interest and trading volume reflect cautious participation as traders await confirmation of the market’s next directional breakout. According to CoinMarketCap, FET is trading at $0.2230 with a weekly gain of 4.84%.


Source: CoinMarketCap
FET Derivative Data Point to Cautious Outlook
According to Coinglass, the FET open interest decreased by 3.36%, showing a slight reduction in outstanding contracts. The total open interest is $83.42 million, suggesting relatively stable positioning with mild contraction in trader commitments across the market.


Source: Coinglass
However, trading volume decreased by 24.18%, reflecting reduced market activity. The total volume recorded stands at $82.48 million, indicating moderate liquidity despite the decline and suggesting a slowdown in participation.
Also Read: FET Momentum Builds With 25% Rally in Sight After Key Resistance Test
FET Price Action Signals Possible Breakout to $1.80
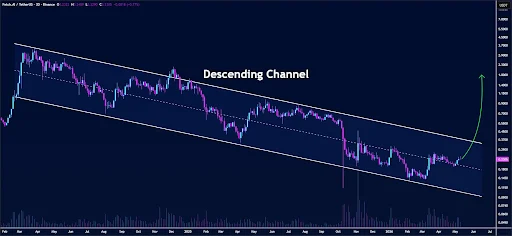
Furthermore, the crypto analyst Butterfly revealed that the FET price is gaining strength as it bounces off the midline of its downward channel over three days.
The buyers are holding their positions strong in this area of support, implying some accumulation activity. The FET price stability in this region shows that selling pressure is diminishing, and traders are waiting for a trend change in the coming major movement.

Source: Butterfly’s X Post
Market players are watching out for any possible breakout in the event that momentum shifts to the upside. A breakout in the FET price will trigger an even stronger uptrend movement, with levels around $1.80 seen as significant targets.
Overall, the setup remains neutral before a breakout is confirmed, although bullish setups are emerging as buying strength increases over the next few sessions.
FET Technical Indicators Point to Improving Momentum
According to TradingView, the FET price has undergone a sharp decline from its highs in mid-2025 before settling into a sideways trend.
Following a fall to about $0.15 early in 2026, the FET price started experiencing a series of rising lows. Currently trading at $0.22365, it appears that the asset is preparing for an upcoming rally.


Source: TradingView
The technical indicators show a neutral market. The RSI level is currently 52.17, indicating balanced buy and sell pressure.
At the same time, the MACD lines are converging towards zero, indicating a slowdown in momentum. It looks like the previous bearish period is ending as the market becomes less volatile and compresses.
This article contains market analysis and price predictions. These are not guarantees. Crypto markets are volatile. Always DYOR. Not financial advice.
Also Read: Fetch.ai Recovery Gains Strength: FET Price Could Surge to 300% Ahead

Be the first to comment