


What to know:
- FET eyes a potential bullish breakout with targets from $0.26 to $0.80 if resistance breaks.
- Coinglass data shows lower open interest and volume, indicating cautious sentiment in FET.
- A MACD bullish crossover and tightening Bollinger Bands suggest reduced selling pressure and a momentum shift.

Fetch.ai (FET) is moving in a positive price trajectory, with the token trying to break the upper boundary of the falling wedge pattern. According to CoinMarketCap, FET is currently trading at $0.2028, with a 24-hour trading volume of $138.02 million and a market capitalization of $458.23 million. Its price has surged by 1.28% over the last 24 hours but remains down by 1.99% over the last week.
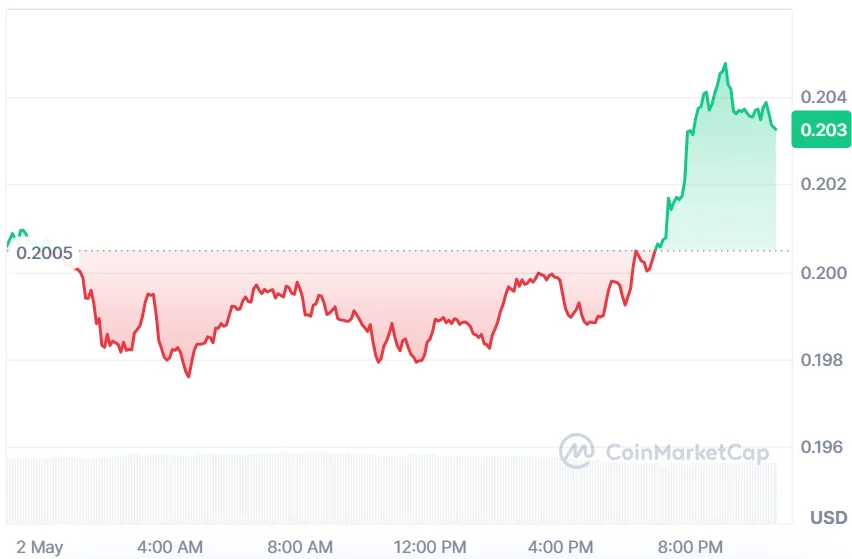

Source: CoinMarketCap
FET Derivative Data Point to Cautious Optimism
According to Coinglass, FET open interest decreased by 0.40%, totaling $81.04M, while volume fell by 11.40% to $51.74M. This reflects a mild reduction in derivatives participation and trading activity, suggesting traders are becoming slightly less active in the current market phase overall.


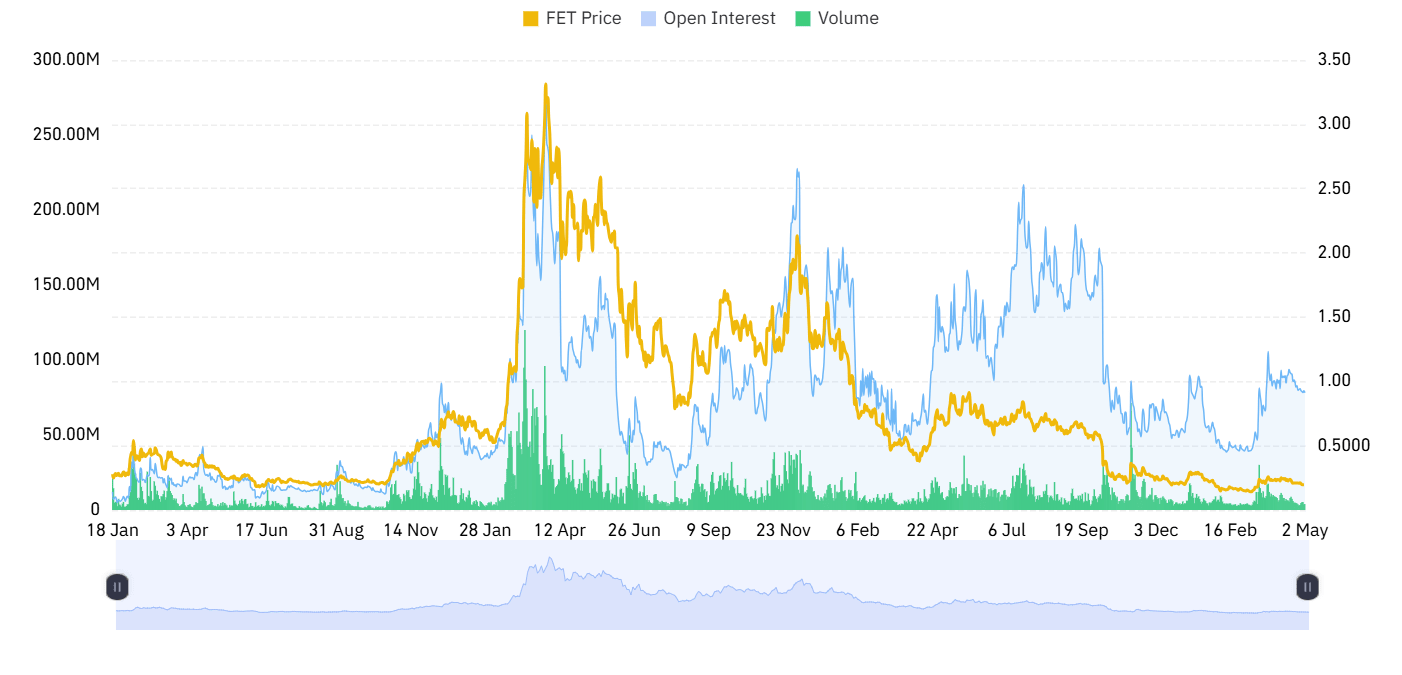
Source: Coinglass
However, the OI weighted rate stands at -0.0023%, indicating a slightly negative positioning bias. This points to mild bearish sentiment in derivatives markets, though the strength of the signal is weak and does not indicate strong directional conviction among traders at present.
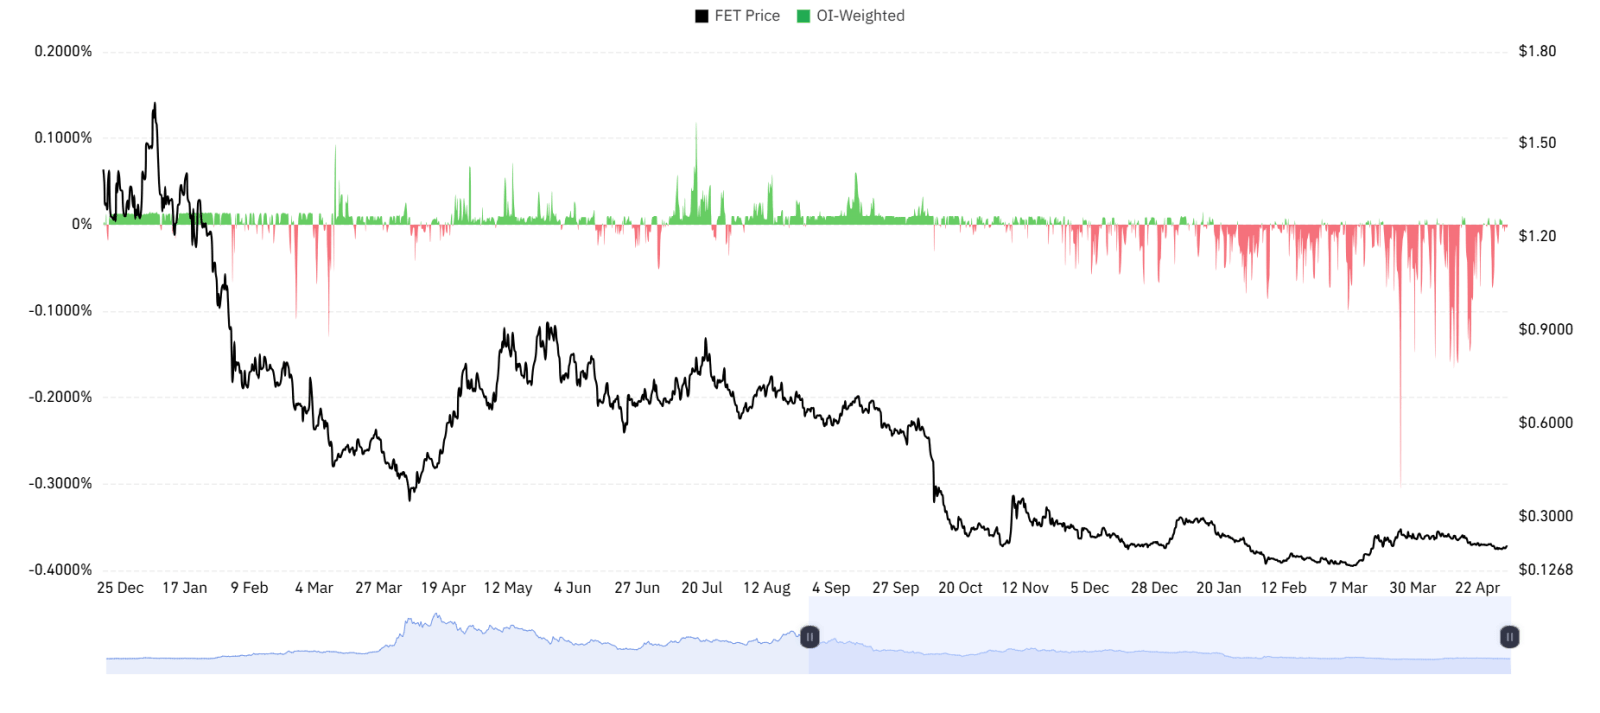
Source: Coinglass
Also Read: Fetch.ai (FET) Outlook Strengthens: Consolidation Phase Signals a Move to $0.22
FET Falling Wedge Signals Bullish Breakout
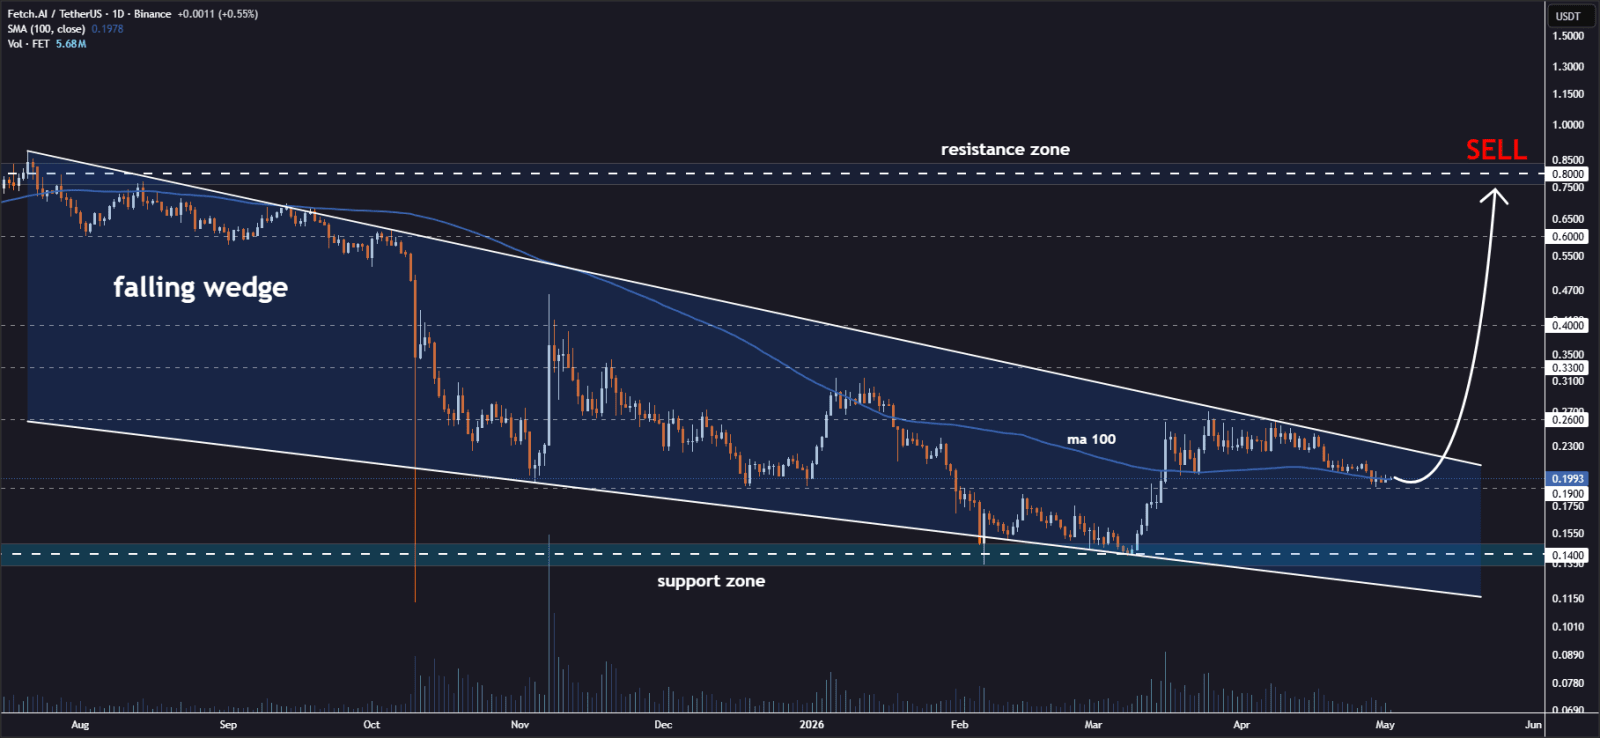
Furthermore, the crypto analyst Jonathan Carter pointed out that the FET price appears to be trading within a tightening falling wedge formation on the daily time frame, with reduced volatility and convergence of the prices.
The structure holds as the support and resistance boundaries approach each other. It usually indicates that selling pressure is declining, and the likelihood of price movement increases.
Source: Jonathan Carter’s X Post
If FET breaches the level of resistance and sustains itself above that level, it can start an advance to targets of $0.26, $0.33, $0.40, $0.60, and $0.80.
As the point of the wedge gets nearer, this area has become a critical area of choice for traders, who are watching developments keenly due to the mounting pressure in the market.
Technical Outlook Points to a Recovery Phase
According to TradingView, FET is emerging from a downward trend and turning a new leaf, breaking out above the 20-period MA after hitting a low of $0.193.
The strong bullish candle formed on the chart suggests that the current sell-off might finally be coming to an end as the price attempts to find its footing.
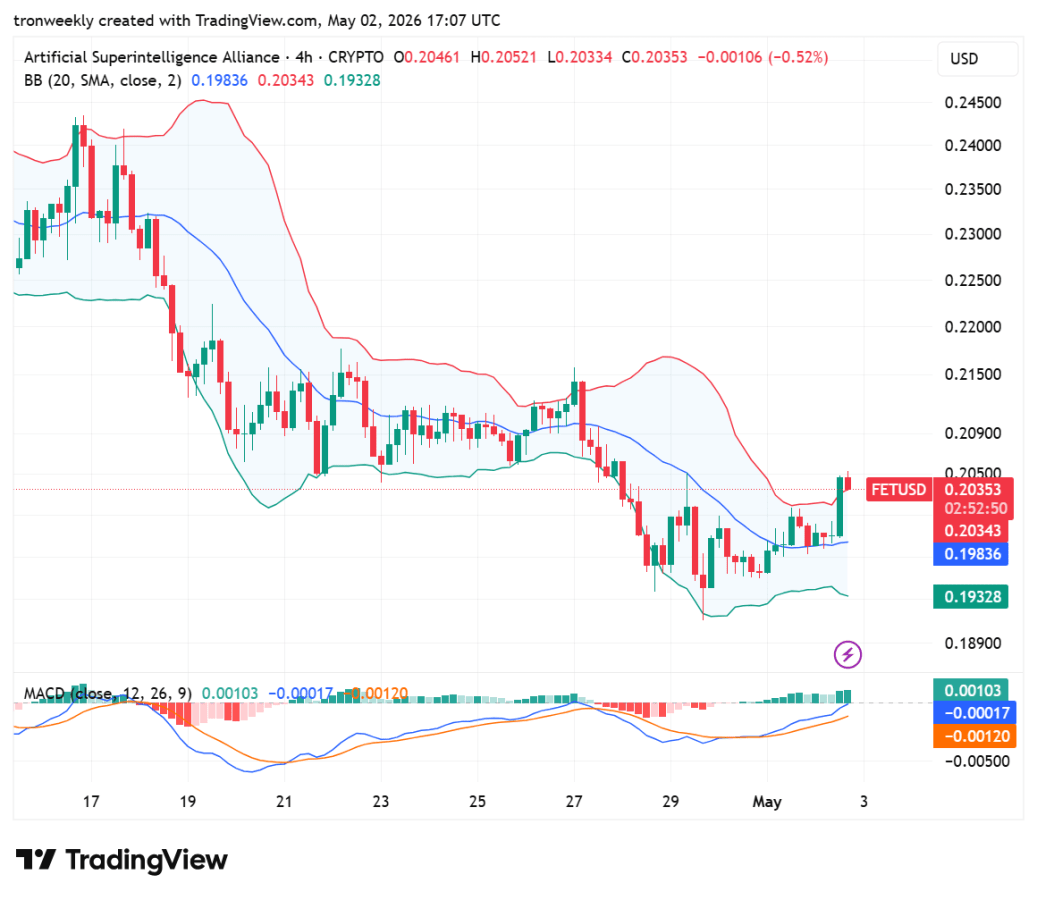
Source: TradingView
Supporting this bullish momentum, the MACD is making a bullish crossover, while the histogram has turned positive.
In addition, the Bollinger bands have narrowed, indicating low volatility amid the pullback seen in the market. Provided the price stays at this level, there will be an upside relief rally for the asset coming out of its local trough.
This article contains market analysis and price predictions. These are not guarantees. Crypto markets are volatile. Always DYOR. Not financial advice.
Also Read: Fetch.ai (FET) Demand Zone Retest Signals Bullish Reversal Toward $0.31

Be the first to comment