


What to know:
- Fetch.ai (FET) holds strong support at $0.220–$0.224, backed by the 50-day and 200-day EMAs.
- Bulls target a breakout toward $0.25 resistance for renewed upside momentum.
- RSI at 46.81 shows neutral momentum, indicating balance between buyers and sellers.

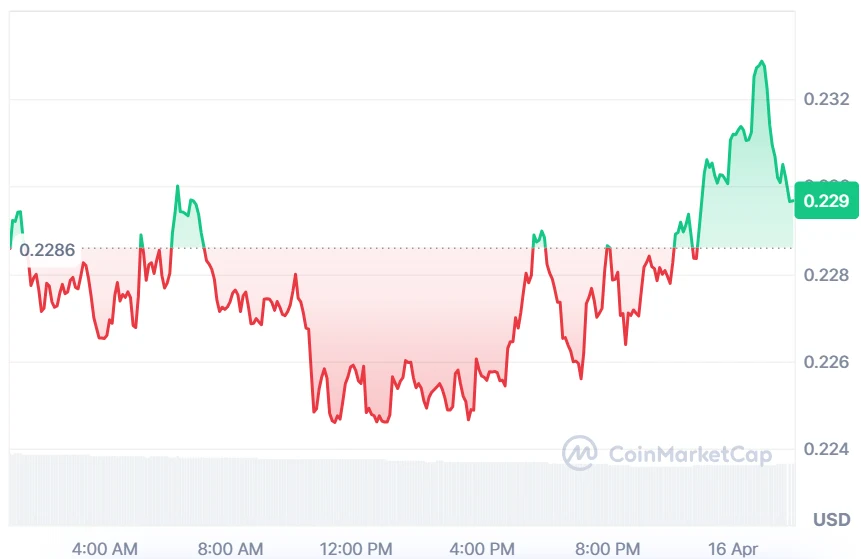
Fetch.ai (FET) is moving in a neutral price setup despite the early signs of bullish momentum in the crypto market. According to CoinMarketCap, the FET price has remained stable over the last 24 hours but it has declined by 5.38% over the last week.
At the time of writing, the token is trading at $0.2294 with a trading volume of $136.26 million, which has declined by 13.22% over the last 24 hours. However, its market capitalization stands at $518.46 million, which is stable.

Source: CoinMarketCap

Also Read: Praxis Integrates Fetch.ai to Power Next-Generation Autonomous Agent Networks
FET Holds Key Support as Bulls Target $0.25 Breakout
Furthermore, the crypto analyst Alpha Crypto Signal highlighted that FET is showing a clean technical structure where price continues to respect a key support zone. Buyers have consistently stepped in at this level, preventing deeper downside moves and suggesting ongoing accumulation.
This behavior reflects a stabilizing market phase, where selling pressure is weakening and the asset is attempting to build a base for potential recovery.

Source: Alpha Crypto Signal’s X Post
If support continues to hold, momentum could shift upward toward the $0.25 resistance area, which now stands as the next major upside target.
A successful breakout above current resistance levels would strengthen bullish momentum, while any breakdown below support would invalidate the setup and likely reopen downside risk in the short term.
Technical Outlook Point to a Consolidation Phase
According to TradingView, FET shows a significant change from the rally seen in mid-March to the consolidation that occurred in April.
With the price having reached its highest point at $0.260, there was a flattening of the price action, leading to a horizontal price channel within the range of $0.220 and $0.250.

Source: TradingView
From technical perspectives, the signs show that the momentum has cooled down inside the stable structure.
At the moment, the RSI indicator has moved back to 46.81, which means that the situation has become neutral, and the overbought pressure is no more. The current price is at the testing stage at the important support area around $0.224.
This article contains market analysis and price predictions. These are not guarantees. Crypto markets are volatile. Always DYOR. Not financial advice.
Also Read: Fetch.ai Technical Setup Strengthens With $3–$4 Range in Focus After Flag Formation

Be the first to comment