


What to know:
- FLOW price confirms bullish market structure shift after liquidity sweep clears weak positions
- Futures volume surges 73% as open interest climbs above $20 million on derivatives
- Key targets set at $0.0466 with invalidation risk below the $0.0325 daily close

FLOW price confirmed a bullish market structure shift, signaling potential continuation toward higher liquidity zones. According to CoinMarketCap, FLOW traded near $0.0400 despite a 3.3% daily decline, as derivatives activity increased.
Analyst Crypto Patel reported that the shift followed a liquidity sweep, a pattern often seen before strong directional moves. The setup suggests growing demand below current levels, positioning FLOW for a possible breakout phase.
As such, this FLOW price analysis represents a possible path to continue upward through various liquidity areas on the higher timeframe.

FLOW Price Analysis Confirms Bullish Structure Shift
Crypto Patel stated that a bullish structure shift has been confirmed. The market structure shift resulted from a liquidity sweep removing weak hands from the marketplace.
The FLOW price analysis displays high order FLOW support within a defined order FLOW region. The FLOW price structure illustrates a typical retracement down into an area where traders may find opportunities to initiate their trades.
High liquidity continues to exist at present pricing levels. Therefore, high pricing areas represent ideal entry points. In addition to finding the spots representing ideal entry points, this FLOW price prediction identifies specific target prices at $0.0380, $0.0420, and $0.0466.
A close lower than $0.0325 would invalidate the current bullish setup and define the downside risk associated with it.


Also Read | Zcash (ZEC) Rising Open Interest Signals Potential Rally Toward $600
Derivatives Activity Suggests Increased Market Participation
CoinGlass reported an over 73% rise in futures volume relative to the prior day. Additionally, open interest surpassed $20 million, illustrating an increasing number of traders participating in the market.
The rising open interest also suggests an increasing amount of expectations regarding volatility. Liquidations totaled over $65,000 within the last 24-hour period.
Most liquidations represented long positions and occurred during the recent pullback. This demonstrates that the weak participants have been eliminated before the price continued the move up.
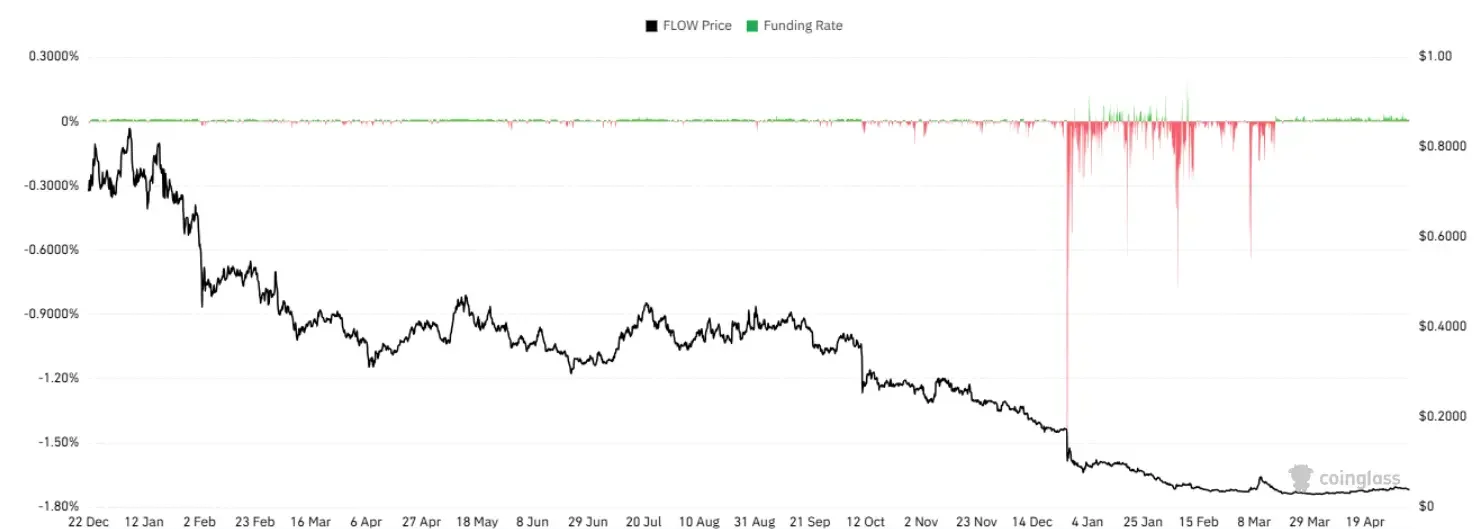
Funding rates remained relatively neutral throughout most exchanges. However, rising open interest is supporting the overall bullish trend.

Technical Indicators Illustrate Possible Higher Prices
TradingView charts indicate that the FLOW price remains above key short-term moving average indicators. In fact, the 20 EMA and 50 EMA are nearing convergence.
Convergence among these indicators typically leads to breakouts or new highs following consolidation patterns. The RSI reading currently sits at approximately 53.
This indicates that the FLOW price is likely entering a state of unbalanced momentum with a big chance for upside growth. The MACD indicator is beginning to show early signs of a bullish cross formation.
Additionally, TradingView reports illustrate that volumes demonstrate continued accumulation rather than distribution. If FLOW holds its order FLOW support zone, the FLOW price should test the resistance at approximately $0.0466.
This FLOW price prediction provides an overview of a technically bullish structure with defined risk parameters.


This article contains market analysis and price predictions. These are not guarantees. Crypto markets are volatile. Always DYOR. Not financial advice.
Also Read | Litecoin Price Analysis: Will It Test $65 in May Upside?
Be the first to comment