


Bitcoin (BTC) may undergo a massive rally, based on a recurring gold chart pattern, with gains of up to 180% over the next 12 months.
Key takeaways:
- BTC is up nearly 40% versus gold since March after falling for seven months in a row.
- Similar BTC/XAU recoveries have historically coincided with Bitcoin bottoms in US dollar terms.
BTC may hit $167,250 within a year
The bullish signal comes from the Bitcoin-to-gold ratio (BTC/XAU), which tracks BTC’s performance relative to gold in US dollar terms. Historically, sharp rebounds in this ratio have aligned with major Bitcoin cycle bottoms, often preceding strong upside.
In 2015, a BTC/XAU bottom preceded a roughly 250% Bitcoin rally within a year.

Similar reversals in 2019 and 2022 came before gains of around 140% each. Excluding 2020’s 1,460% liquidity-driven boom, the pattern points to an average one-year BTC gain of about 180% after BTC/XAU bottoms.
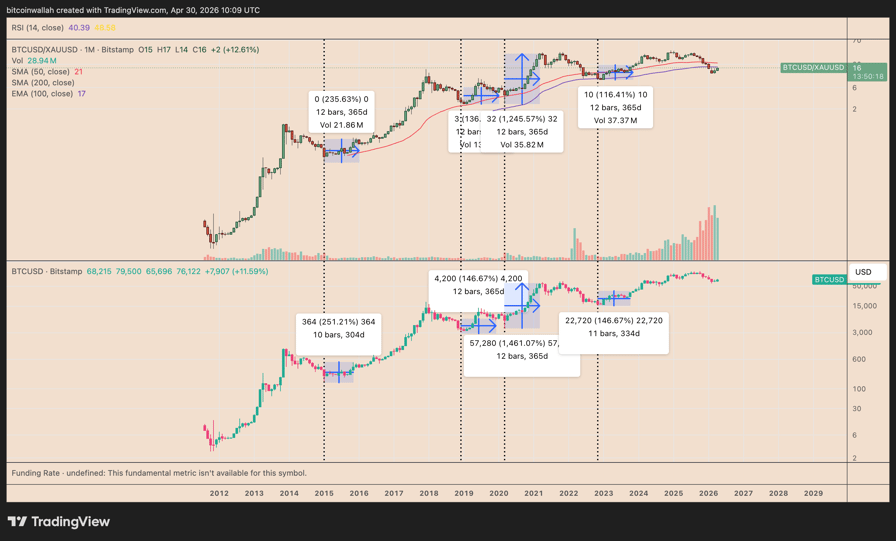
BTC/XAU monthly chart. Source: TradingView
As of 2026, the BTC/XAU ratio has climbed about 40% since February’s lows. The BTC/USD rate has jumped 32.65% in the same period.
“Bitcoin versus gold is about to close a second month in the green after 7 red candles in a row,” said Nik Bhatia, founder of macro research firm The Bitcoin Layer, adding that “the bounce is in.”
Macro strategist Gert van Lagen spotted a “hidden bullish divergence” pattern that appeared following the 2014, 2018, and 2022 bear market bottoms.
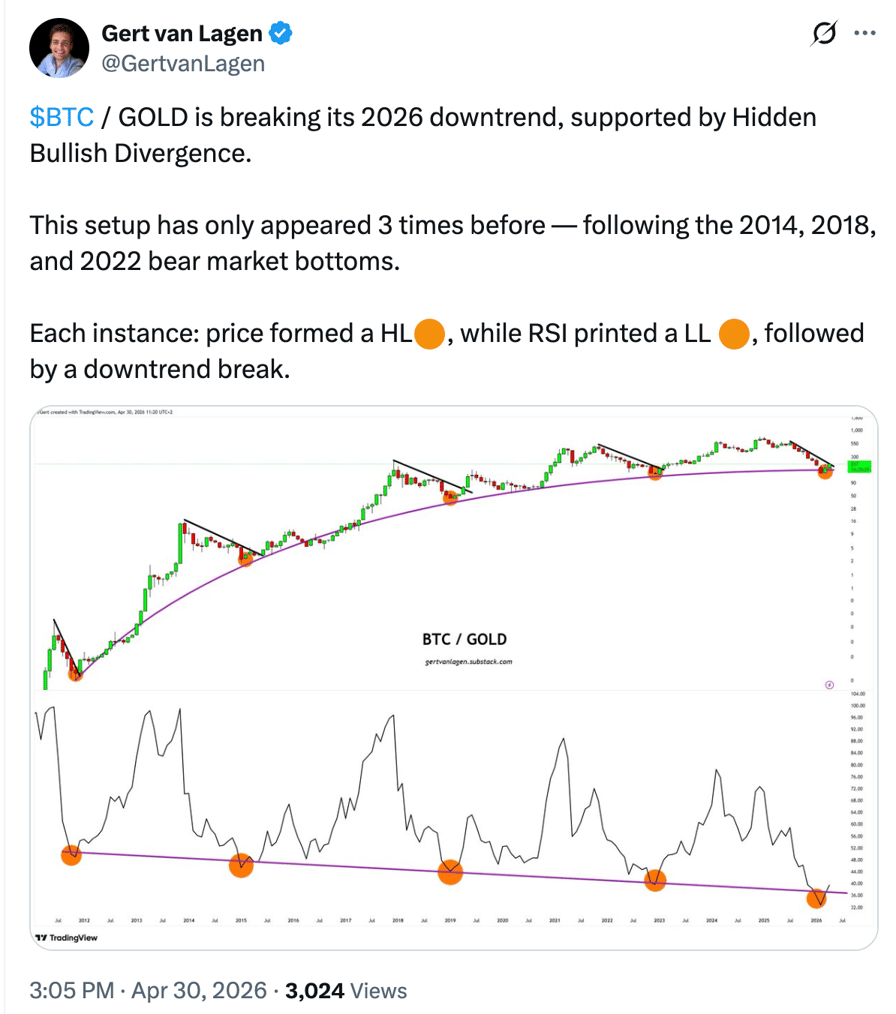
Source: X
In its April report, meanwhile, Fidelity Investments said Bitcoin has entered “an accumulation phase” while outperforming gold.
A 180% repeat of past cycles puts the BTC price target at $167,250 by April 2027, if the BTC/USD and BTC/XAU February lows are confirmed as bottoms.
Multiple analysts, including Bernstein’s Gautam Chhugani, have projected BTC’s price to reach the $150,000 mark in 2026, driven largely by a potential capital rotation from gold.
In April, Matt Hougan, chief investment officer of crypto asset manager Bitwise, said Bitcoin can become bigger than the gold market’s $30 trillion capitalization.
Key trend line puts bullish outlook in doubt
BTC/XAU remains below its 100-month exponential moving average (100-month EMA, the purple line), a level that previously marked major bottoms in March 2020 and December 2022.
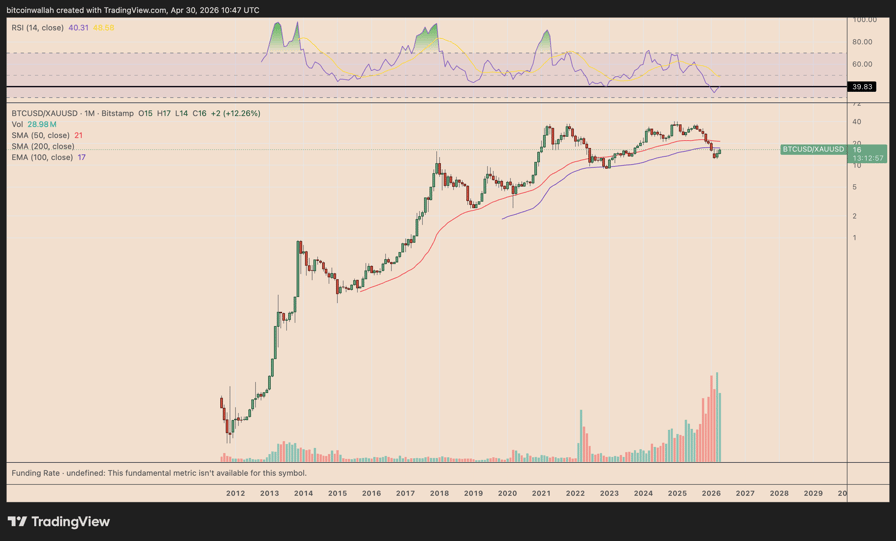
BTC/XAU monthly chart. Source: TradingView
Its January breakdown was the first clear loss of this support. Staying below it risks trapping bulls and delaying Bitcoin’s relative recovery against gold.
In the short term, BTC/XAU also faces resistance from a rising wedge on the daily chart.
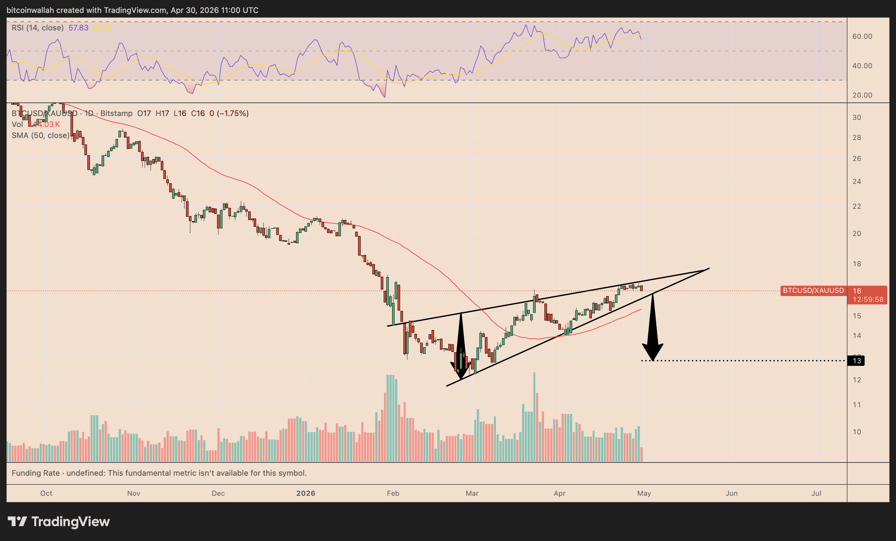
BTC/XAU daily chart. Source: TradingView
The bearish reversal setup points to a potential 20% drop in Bitcoin’s gold-denominated value, based on the wedge’s measured move.
Related: Bitcoin eyes $75K after ‘most hawkish’ FOMC as oil hits highest since 2022
Macro conditions, such as elevated US bond yields and rising oil prices, may also disrupt historical patterns. As Cointelegraph reported, Bitcoin derivatives show traders are cautious as the Fed holds interest rates and BTC price consolidates.
Be the first to comment