



Bitcoin entered the weekend with a local rally, settling around $81,280 after gaining around 4% over the past 24 hours. The main driver of market debate has been the “golden cross,” a chart pattern in which the 50-day moving average crosses above the 200-day moving average.
You Might Also Like


For retail investors, this is traditionally a signal of the beginning of a global bull market. However, popular analyst Benjamin Cowen is urging caution against jumping to conclusions.
In his view, at $81,280, Bitcoin has entered a zone of historical uncertainty, where a classic liquidity trap could be hiding behind the appealing facade of a technical indicator, raising serious concerns among experts.
Why the current surge to $81,280 does not mean the bear market is over
While retail traders link the current rally to speculation surrounding future interest rates, the real intrigue is unfolding exclusively on the price chart.
Benjamin Cowen emphasizes that Bitcoin price declines during the formation of golden crosses are perfectly normal. This is precisely the scenario the market witnessed in the first half of September, when the asset experienced a local pullback.
A far more important and telling factor, according to the analyst, is how the current rebound to $81,280 ultimately plays out. This move divides historical precedents into two opposing camps.
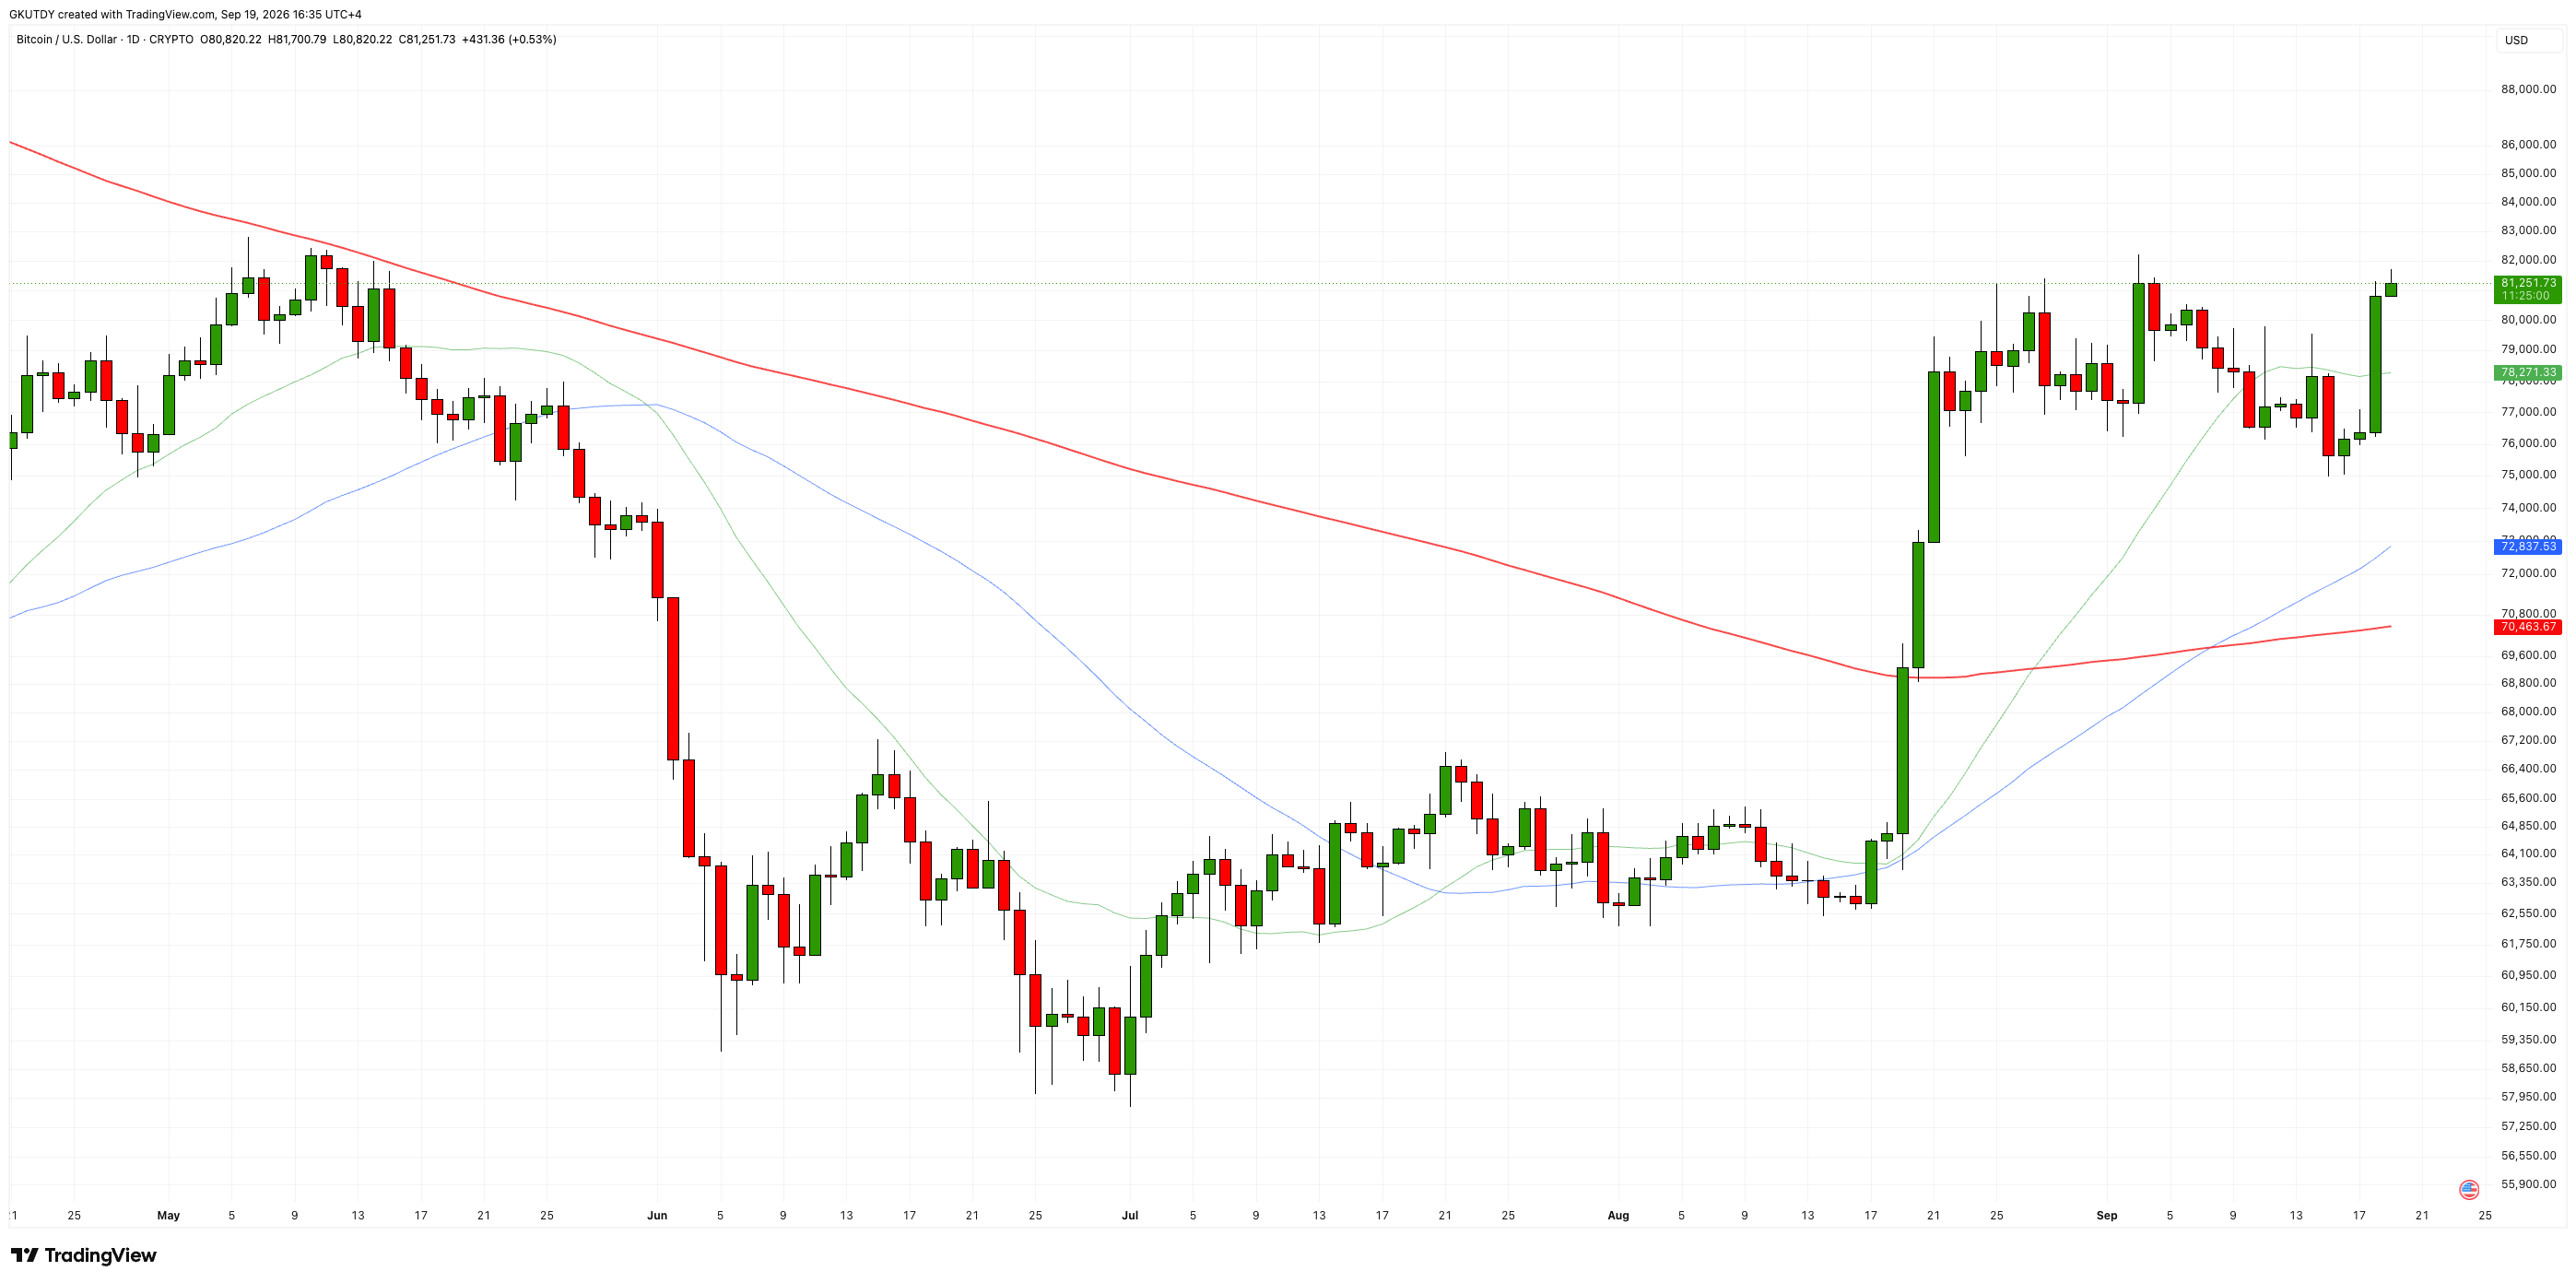
The first possibility is the bullish scenario of 2019 and 2023. Cowen notes that during those cycles, Bitcoin managed to recover from the post-cross sell-off, stage a rally, and establish a higher high, ultimately breaking the back of the bear market.
The main confirmation of this outcome now would be a decisive breakout above the psychological resistance zone and weekly candle closes above the 50-week simple moving average (50W SMA).
As the analyst explains, breaking the bearish scenario requires precisely “a higher high paired with weekly closes above the 50-week SMA,” which would significantly weaken the bears’ position.
You Might Also Like

The second possible outcome is a dangerous repeat of the 2014–2015 scenario. According to Cowen’s analysis, if the current recovery runs out of steam and the price faces a firm rejection at current levels, the market will form a lower high.
In that case, a classic “rejection at those levels to support bear market continuation” would occur, and the broader bear market would continue in line with the historical pattern.
For those trying to understand what to do next, Cowen provides a clear reference point: do not give in to weekend emotions and calmly monitor price action around the 50W SMA at weekly closes. This is the level that will distinguish a genuine reversal of the broader trend from yet another trap for overly optimistic buyers.



Be the first to comment