


Arbitrum slipped 3.13% to about $0.16, briefly dipping below the midpoint of its rally from $0.07 to $0.26 before buyers pulled it back above that line.
Key Takeaways
ARB down 3.13% near $0.16 on Binance
Price sits on the 50% Fibonacci retracement
Resistance cluster near $0.19: 38.2%, 50-day SMA
Daily RSI at 40.34, below its signal line
Half the rally is gone
The Fibonacci grid runs from the swing low near $0.07 to the peak near $0.26, which puts the 50% retracement at roughly $0.164. ARB’s intraday low slipped under it before price crept back above, so the first buyers have shown up. Whether they hold the line depends on where today’s candle closes.
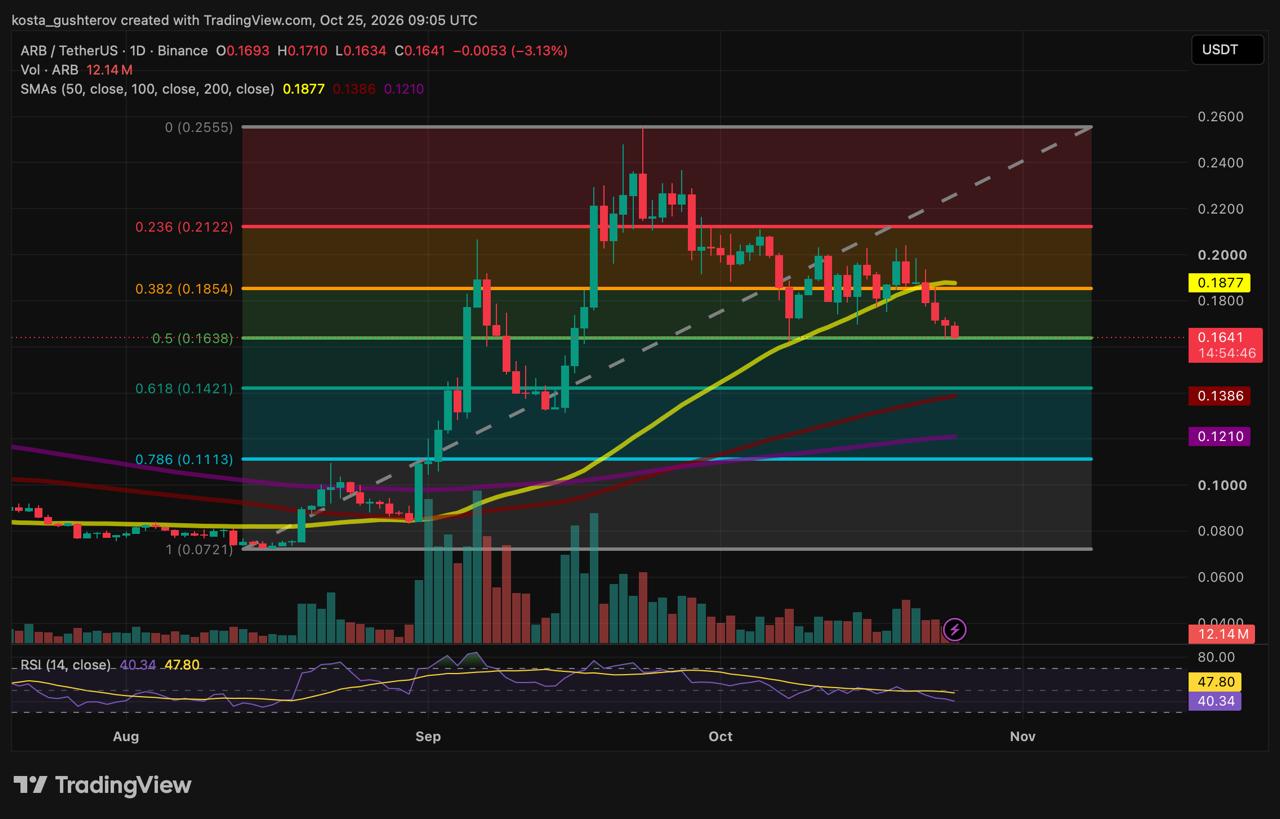
From the top, ARB is down about 36%. Measured against the whole run from $0.07, it has handed back half. The two numbers describe the same pullback from different starting points, and together they show a deep correction inside a rally that is still well above where it began.
The rally covered about $0.18, so each Fibonacci step is a real distance at this price. The drop from the 50% line to the 61.8% level near $0.142 is about two cents, or roughly 13% below where ARB trades now.
$0.19 is now the line to beat
The sell-off broke ARB below its rising trendline, drawn dashed on the chart, and below the 50-day simple moving average, the yellow line near $0.19. The 38.2% retracement sits in the same area and gave way on the way down. With three references stacked there, $0.19 has turned from support into the main ceiling.
That ceiling, with the 38.2% level near $0.185, sits about 13% above the current price, almost the same distance as the next support below. ARB is trading roughly halfway between its nearest resistance and its nearest floor, which is why the daily close at the midpoint matters more than usual.
Getting back above the average alone would not be enough, because the trendline keeps rising over time and would also need to be reclaimed. Above that, the 23.6% retracement near $0.21, where the breakdown started, is the next hurdle, with the $0.26 peak beyond it.
Momentum hasn’t turned
The daily RSI reads 40.34 and is still pointing lower, under both the 50 midline and its signal line at 47.80. That is weak but not oversold, since the usual oversold mark is 30. The first sign of selling pressure easing would be the RSI turning up and crossing back over its signal line, which is still more than seven points above it.
The moving averages give a more mixed picture. The 50-day sits near $0.19, above the 100-day near $0.14 and the 200-day near $0.12, which is still the order of a longer-term uptrend. The short-term damage is real, but the broader structure has not flipped. Daily volume stood at 12.14 million ARB, roughly $2 million at current prices.
Upside: A daily close above the 50% level keeps the bounce alive, and a move toward $0.18 would extend it. The real test is the $0.19 cluster. Reclaiming it, along with the trendline, would bring $0.21 into view.
Rejection: A clear daily close below the midpoint would undo the intraday recovery and put $0.14 in play, where the 61.8% retracement sits just above the 100-day SMA. Below that, the 200-day SMA near $0.12 and the 78.6% retracement near $0.11 come next.
Bigger picture: While ARB stays under the broken trendline and the 50-day average, bounces look like relief moves inside a correction, not a new uptrend. Each lower level is a reference point, not a guaranteed floor.
This article is provided for informational purposes only and does not constitute financial or investment advice.

Kosta has reported on cryptocurrency markets and blockchain infrastructure since 2020, bringing over six years of hands-on experience in the crypto industry built through daily tracking of markets, trends, and emerging blockchain developments. Specializing in Bitcoin on-chain analysis, institutional ETF flows, and digital asset price action, his work at Coindoo has been cited by other news agencies and consistently covers market developments with a focus on data-driven reporting across Bitcoin, Ethereum, Solana, and XRP.
Over the years, Kosta has contributed to multiple crypto media outlets in different regions, authoring over 6,000 articles across the sector. His reporting spans cryptocurrency markets and the broader fintech industry, tracking not only price action but also the technological and regulatory forces shaping the ecosystem.
To support his analysis, Kosta actively leverages on-chain data and metrics from leading platforms such as Santiment, Glassnode, and CryptoQuant, enabling deeper, evidence-based market insights. He believes in the power of transparency and the data that underpins the blockchain ecosystem.
His academic background in Marketing Management from Denmark further complements his analytical approach, adding a strong understanding of communication strategy and content positioning to his work.



Be the first to comment