



From early June, Sui [SUI] token prices have hovered around the $0.65 low, but this changed rapidly over the past few days of trading. The Bitcoin [BTC] momentum translated well across the crypto market, and many alts have seen double-digit percentage gains this week.
SUI was one such, rallying 27.5% in three days, from $0.65 to $0.83 at the time of writing. Beyond the market-wide bullish sentiment, the Aftermath Perpetuals Futures V2 going live on the Sui mainnet also likely helped bolster sentiment.
Two audit reports have been published, and 15 markets, including Bitcoin, gold, and silver, have gone live onchain.
The $0.78-$0.83 supply zone was smashed apart fairly easily during the rally, and has since been retested as support. This has opened the way for a bigger price move toward $1.25 or higher.

Arguments for SUI as a buying opportunity
In a series of posts on X, crypto analyst Ali Martinez explored why the Sui token was about to rally and take market participants unawares.
The TD Sequential technical indicator on the monthly timeframe gave a buy signal. Generally, such a shift signals a potential 1-4 month upswing in price action.
SUI on the monthly chart was also forming a doji star on the monthly timeframe, a pattern that tends to accompany the end of a downtrend.
Social media engagement remained negative, but onchain activity was soaring. Active addresses have risen 250% over the past week.
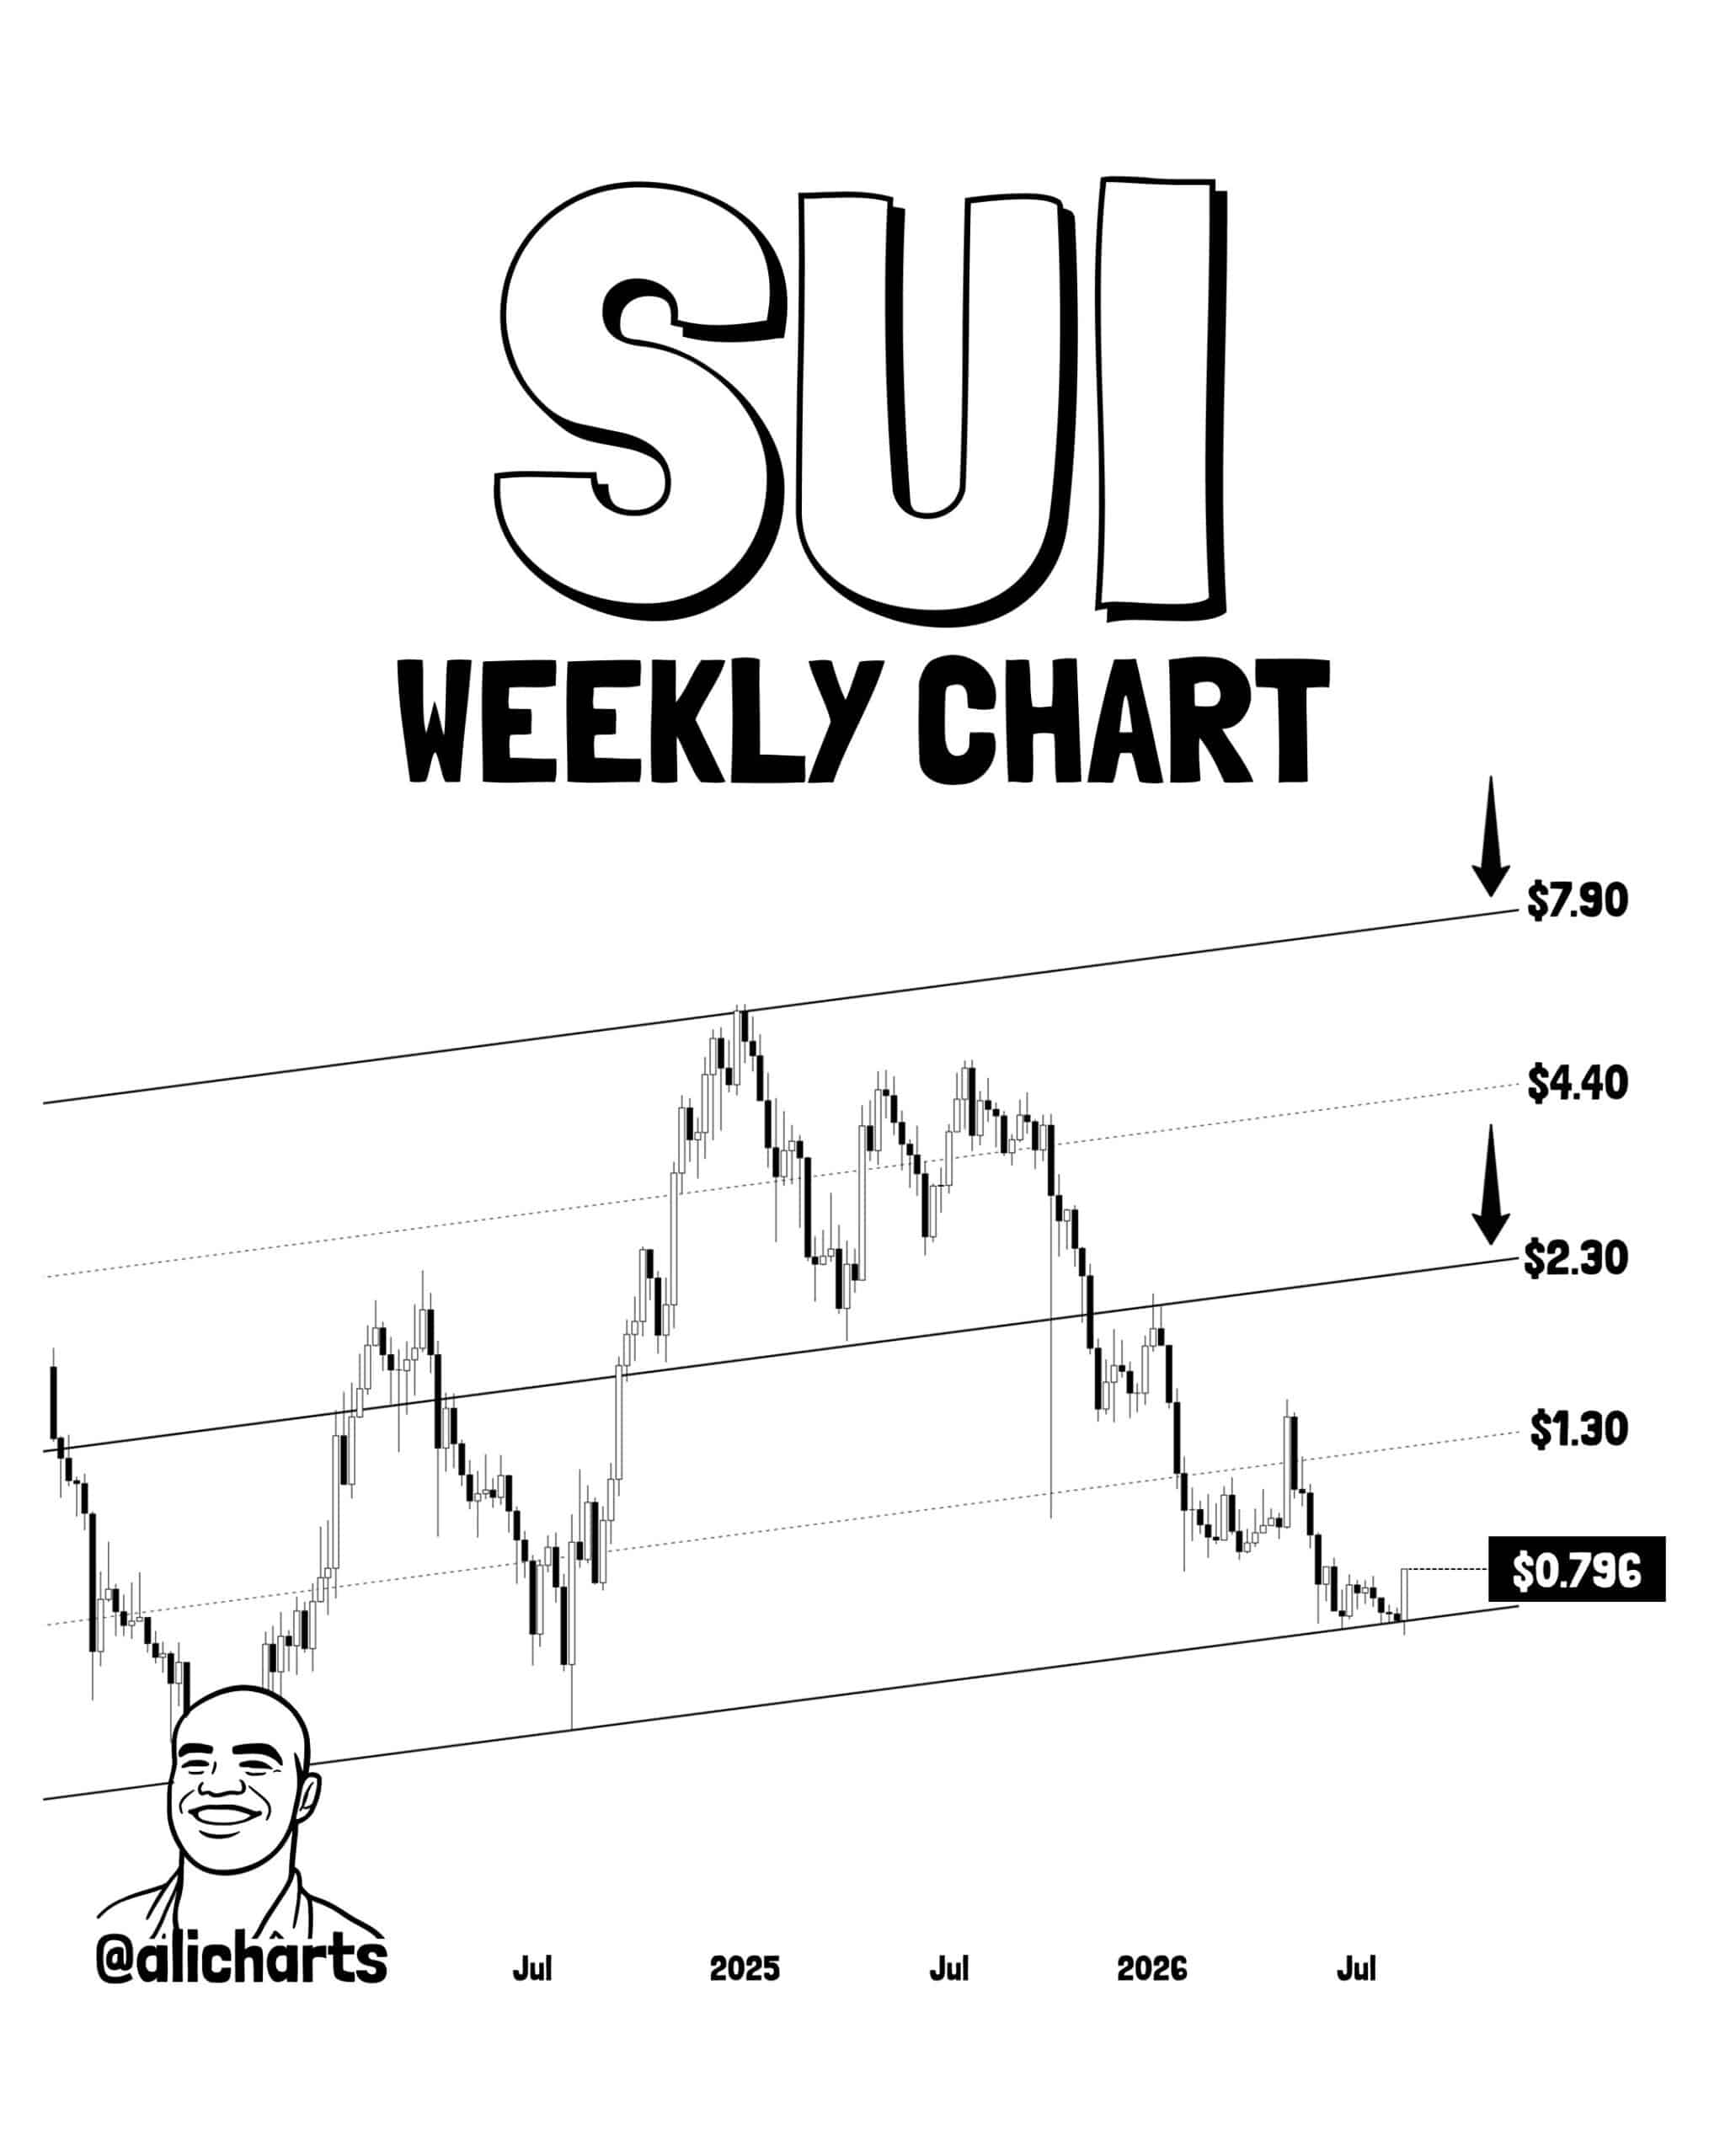
The analyst concluded that price action, onchain activity, and sentiment were “beginning to align”. Bullish price targets included $2.30 as the rising channel’s mid-level, with $7.9 being the other, much more optimistic target.
Traders’ call to action- Watch the SUI structure
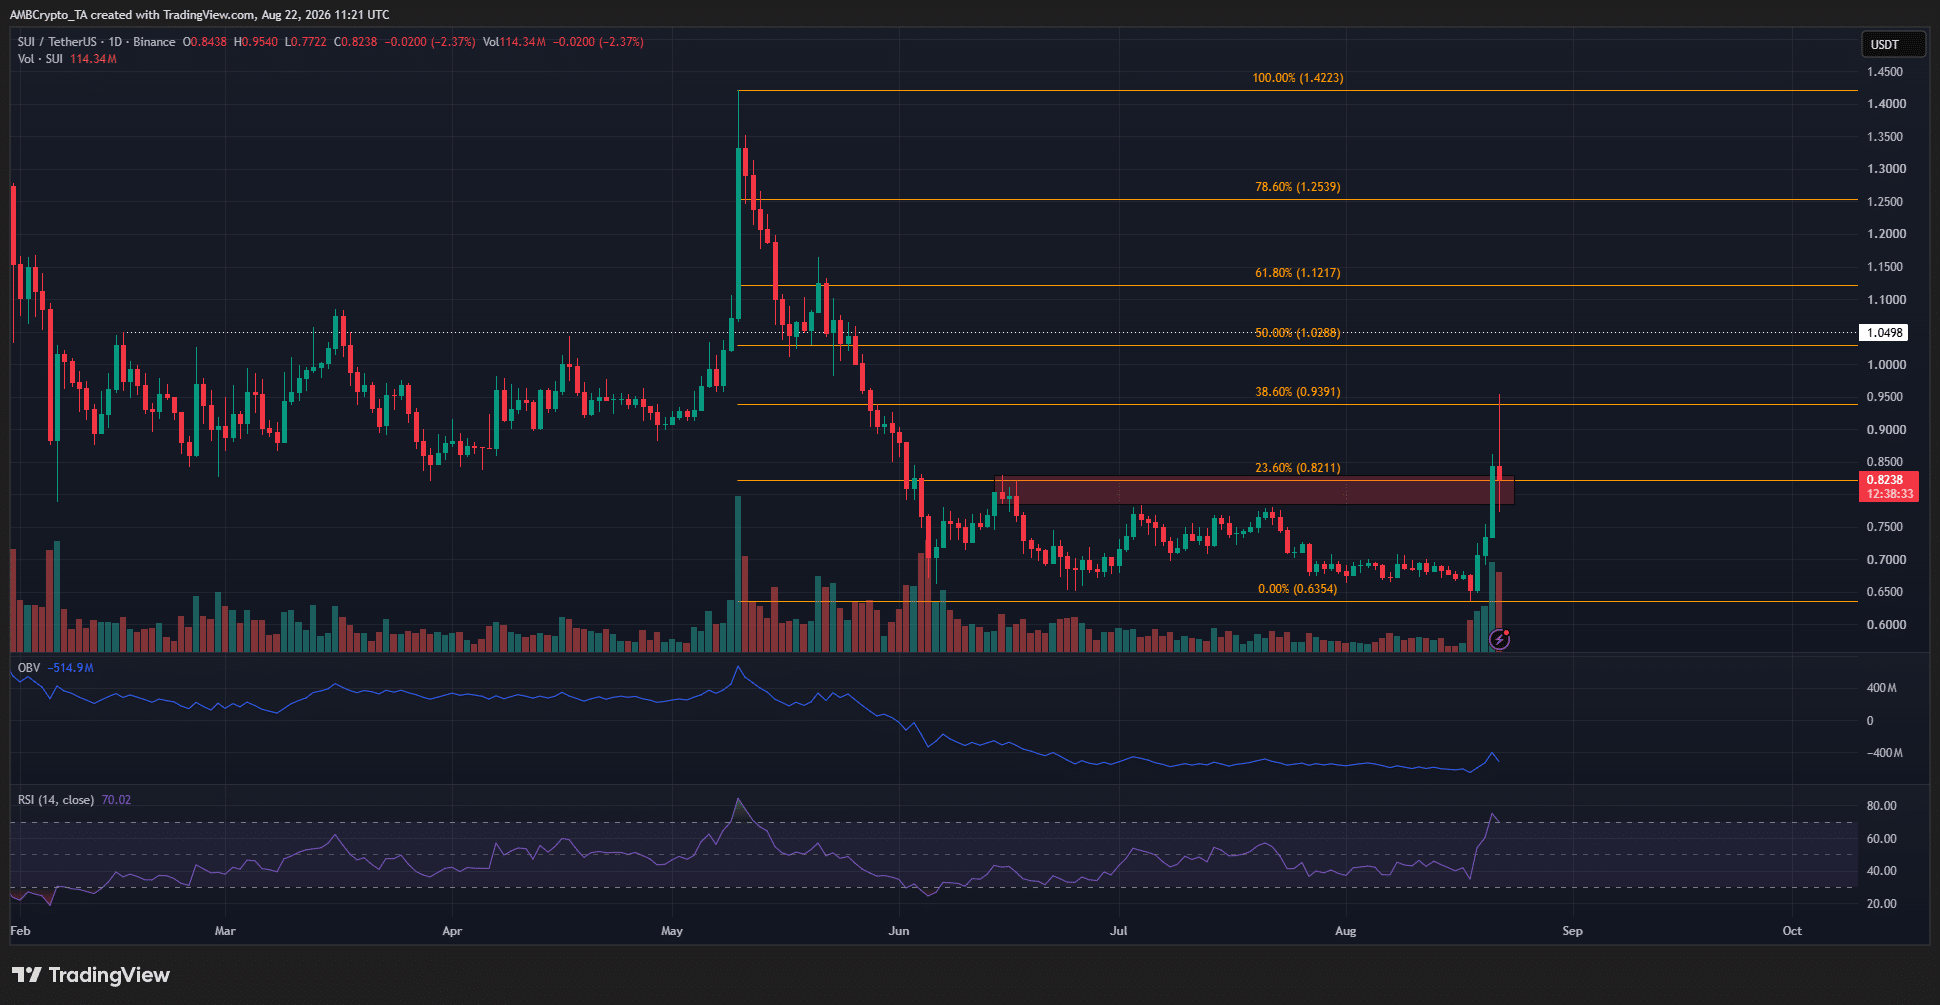
AMBCrypto reported recently that the swing structure of the altcoin was still bearish on the 1-day timeframe. The recent gains have not refuted this fact yet.
The Fibonacci retracement levels showed that the current rally was a pullback within the broader downtrend. This rally can comfortably reach $1.12-$1.25, now that the $0.80 area has been flipped.
A breakout past the $1.42 swing high is needed to shift the structure bullishly. Until market participants see sustained buying and a move beyond $1.25, the bearish bias on this timeframe is valid.
Final Summary
- Sui offered multiple technical indications of a bullish trend flip and a potential rally to $2.30, according to analyst Ali Martinez.
- On the flip side, the swing structure was still bearish, and the current rally was only a pullback within a broader downtrend.


Be the first to comment