



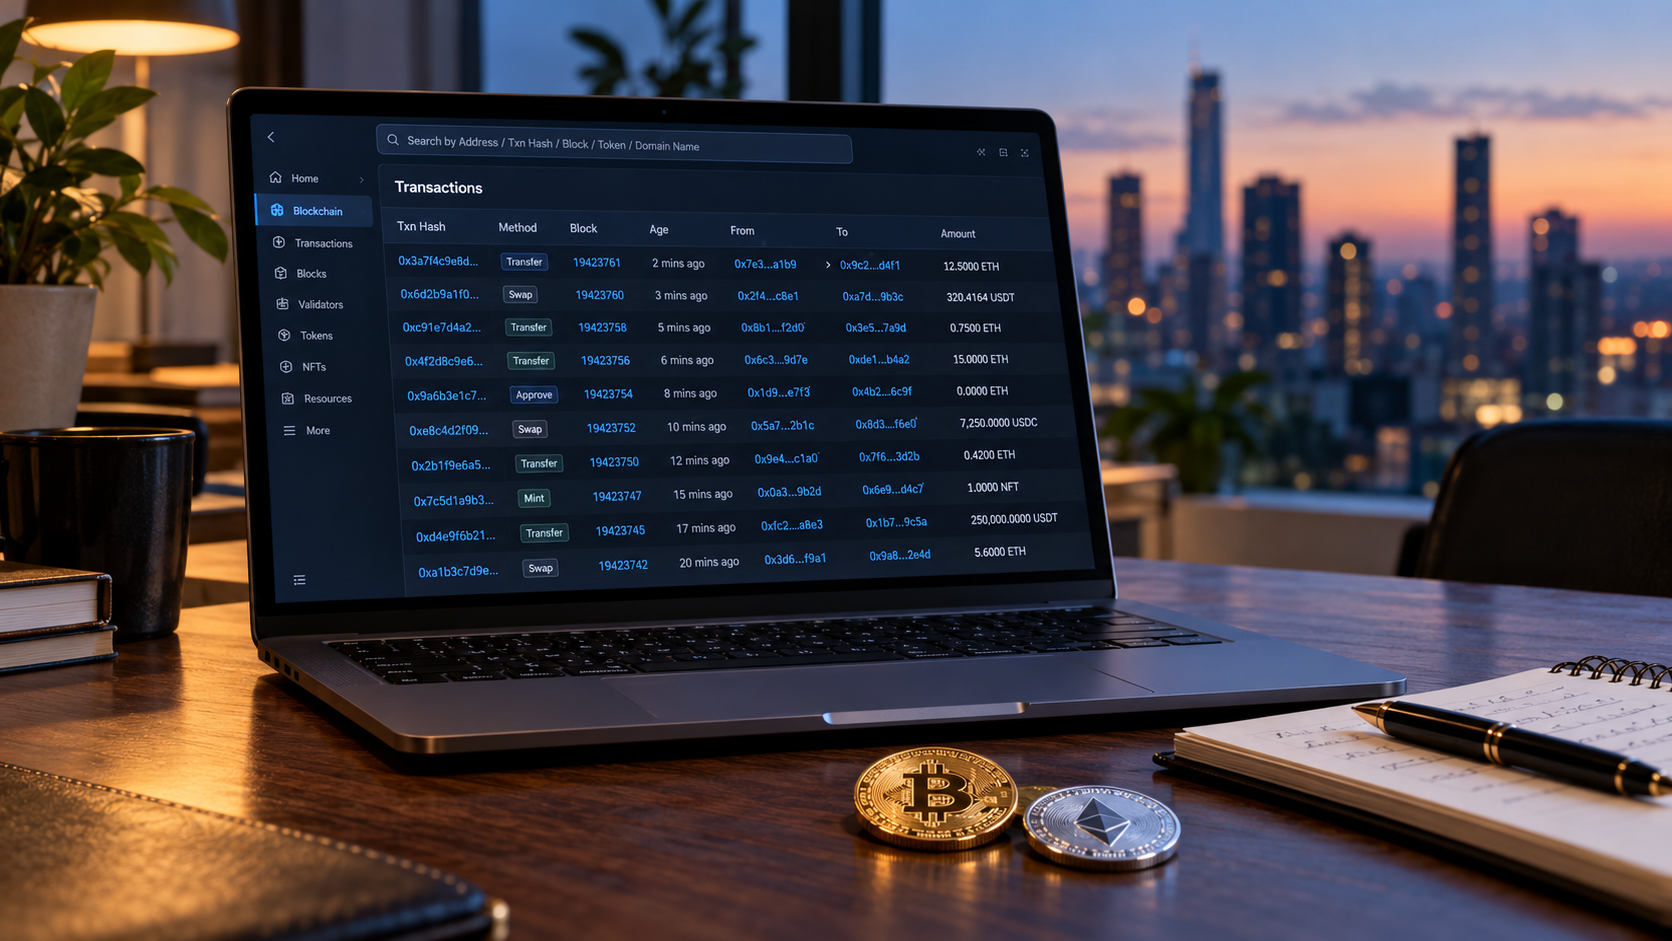
The crypto markets are moving rapidly. Traders and investors are always on the lookout for signals that help them determine the next move in the market.
Unlike traditional markets, crypto has its own advantage in the form of earnings reports and news events; these are quarterly. All transactions, wallet transfers and smart contract interactions are stored on an open ledger.
This data is public information and is referred to as on-chain data. On-chain metrics, if interpreted properly, can provide a window into the actions of large market movers ahead of price charts.
What Are On-Chain Metrics?
On-chain metrics are data points that are collected directly from a blockchain network. They do not track the order book of exchanges, but rather activity on the network.

Each time a user makes a Bitcoin transaction, they are creating a permanent record, as are the creation of tokens or interactions with a decentralised finance protocol.
On-chain data is transparent, real-time and cannot be obscured or delayed as in off-chain data. This information is used by analysts to make their judgment regarding the health of the network, investor behavior, and overall market sentiment.
For those looking to expand their understanding of fundamental technology terms and digital infrastructure, resources like Webopedia provide clear breakdowns of essential tech concepts.
Key On-Chain Metrics Every Analyst Watches
To make sense of raw blockchain data, analysts group information into key indicators. Here are the primary metrics used to monitor market activity.
1. Exchange Netflow
Exchange netflow measures the net amount of coins moving into or out of centralized exchange wallets.
- Exchange Inflows: High inflows mean investors are moving tokens onto exchanges. This usually signals an intent to sell, which can create downward price pressure.
- Exchange Outflows: High outflows show tokens moving from exchanges into private cold storage wallets. This indicates long-term holding and reduces immediate sell pressure.
- Monitoring netflow helps analysts determine whether supply is accumulating or preparing to hit the market.
2. Whale Wallet Tracking
Cryptocurrency whales are individuals that possess substantial amounts of a specific cryptocurrency. Their trades can cause market prices to shift a lot due to their size.
The whales’ wallets are tracked by on-chain tools that notify analysts when they send large amounts of money. For example, in cases where thousands of tokens pour into a dormant wallet, it can cause an area of prudence.
Conversely, steady accumulation by large wallets during market dips suggests institutional confidence in future price recovery.
3. Active Addresses and Network Growth
The adoption and usage of a blockchain are closely linked to its value. Daily active addresses measure the number of distinct users who are engaged with the network on a daily basis.
- Growing active addresses signal rising user adoption and utility.
- Declining active addresses suggest falling interest, even if the price remains steady.
- When price increases while active addresses decline, it can signal a market divergence, warning that the rally may lack fundamental support.
How On-Chain Data Complements Technical Analysis
Traditional technical analysis focuses on price charts, moving averages, and trading indicators like the Relative Strength Index (RSI). While useful, chart patterns only show historical price action.
On-chain analysis acts as an added layer of truth behind the chart patterns:
| Analysis Type | Focus Area | Primary Goal |
| Technical Analysis | Price patterns & volume | Spot momentum and key price levels |
| On-Chain Analysis | Wallet movements & coin age | Measure underlying holder behavior |
Combining both methods gives traders a clearer picture. For instance, if a token reaches a major resistance level while exchange inflows spike, the probability of a price drop increases.
On the other hand, if a breakout occurs while exchange reserves hit multi-year lows, the upward trend may have stronger backing.
The Role of Long-Term Holder Realized Cap
Another big thing to understand in on-chain tracking is finding out the distinction between short-term holders vs. long-term holders.
Short-Term Holders (STHs): Wallets with tokens for less than 155 days. These traders will be more responsive to short-term market fluctuations and news events.
Long-Term Holders (LTHs): Wallets that have been holding tokens for more than 155 days. These investors will tend to be “long-term” investors.
As long-term buyers start to sell into price rallies, it can be an indicator that a market cycle is near a local top. On the other hand, when the market is in a prolonged bear trend, heavy accumulation by long-term investors is typically the historical cycle bottom.
Final Thoughts
On-chain measures eliminate much of the noise from the analysis of the crypto market. Investors can gain more insight into market fundamentals through direct blockchain activity monitoring, including exchange transactions, whales, and active addresses.
On-chain data isn’t always a reliable indicator of future price action, but it’s one of the most potent methods to assess genuine market supply and demand.


Be the first to comment