


What to know:
- Hyperliquid (HYPE) drops after breaking a key trendline, signaling weaker bullish momentum and bearish pressure.
- Trading volume rises 9.31% to $1.06B, showing higher participation and potential short-term volatility.
- Analysts flag $38.80 as key support for HYPE, with a break possibly leading toward $36–$34 levels.
Hyperliquid (HYPE) has declined recently, breaking a key trendline and showing weakening momentum with increased selling pressure. Technical indicators suggest fading bullish strength for the HYPE price as momentum cools.
Derivative data shows stable positioning and rising trading activity, indicating consolidation while traders wait for clearer market direction. According to CoinMarketCap, HYPE is trading at $39.15 with the daily decline of 2.76%.
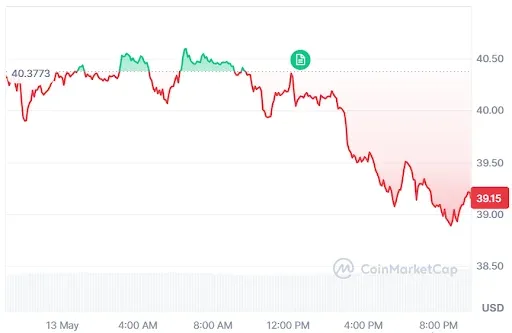

Source: CoinMarketCap

HYPE Derivatives Point to Improving Outlook
According to Coinglass, the HYPE open interest remains stable at $1.53 billion, indicating balanced positioning among traders with no major buildup or liquidation pressure. This suggests the market is consolidating, as participants wait for clearer direction before significantly increasing or reducing exposure.
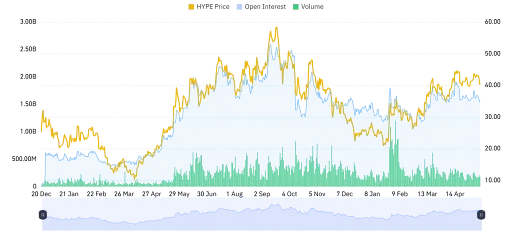

Source: Coinglass
Trading volume rose 9.31% to $1.06 billion, reflecting increased market activity and participation. This uptick signals improving liquidity and heightened trader engagement, potentially leading to short-term volatility as participants adjust positions in response to evolving market sentiment and price movements.
Also Read: Ondo Finance Integrates Tokenized Stocks into Hyperliquid DeFi
HYPE Price Faces Pressure After Trendline Collapse
Furthermore, the crypto analyst Umair Crypto revealed that despite the recent 8% decline in the HYPE price from its previous level, the current structure is still valid.
However, there are some signs that suggest a slowdown in momentum initially. A significant trend line has been broken, and strong bearish candles signal that buyers are losing ground due to a shift in sentiment.
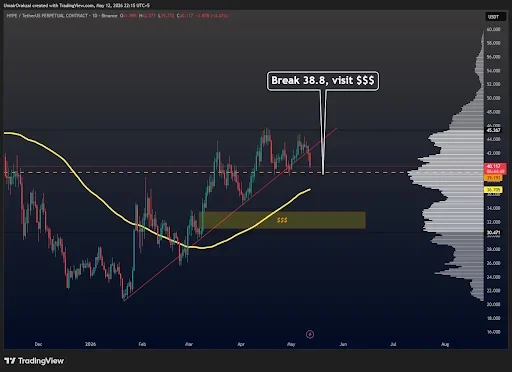

Source: Umair Crypto’s X Post
Such a move would place increased pressure on the prevailing outlook, with traders watching $38.80 as a key resistance level for the HYPE price that needs to be defended.
This is because holding above this level would allow for a stable trading range, while falling below it rapidly could lead to more selling anxiety.
Technical Indicators Point to a Cooling-Off Period
According to TradingView, the HYPE price shows strong signs of an imminent bearish turn, having reached a high of $44.00 this year.
The HYPE price is currently standing at $39.06, which means it has dropped below its 20-day and 50-day moving averages. These indicators show that any previous bullish trends are becoming weaker.


Source: TradingView
Technical indicators confirm that the market is entering the cooling period, with the relative strength index dropping to 39.65. The decline indicates increasing sell interest and a trend towards bearishness.
If the HYPE price continues to decline, investors can anticipate support at the 100-day SMA level of $36.77 or the 200-day SMA level of $34.00.
This article contains market analysis and price predictions. These are not guarantees. Crypto markets are volatile. Always DYOR. Not financial advice.
Also Read: Hyperliquid ETF Filing by Grayscale Adds Staking Feature for HYPE Investors

Be the first to comment