


What to know:
- Hyperliquid (HYPE) remains bullish despite a failed breakout, with analysts targeting a recovery toward $76.
- The $62 level remains key support, and holding above it could trigger another rally.
- The RSI at 57.98 remains above its signal line, indicating buyers still control momentum.

Hyperliquid (HYPE) remains in a bullish trend despite a failed breakout attempt, with traders viewing the recent pullback as a temporary correction for the HYPE price rather than a reversal. Strong technical indicators and sustained buyer control suggest momentum could recover, allowing the asset to potentially retest its previous peak if key support remains intact.
At the time of writing, HYPE is trading at $69.52 with a 24-hour trading volume of $652.99 million and a market capitalization of $17.62 billion. Following the 1.55% gain over the last 24 hours, the HYPE price structure and strong technicals point to a bullish reversal ahead.
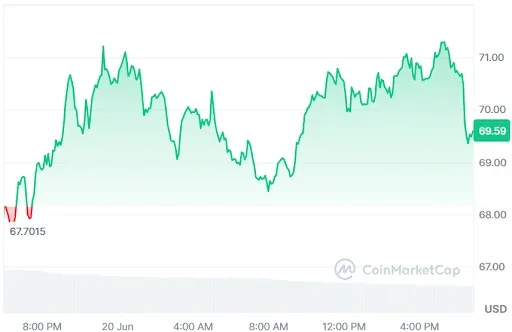

Source: CoinMarketCap

Also Read: Hyperliquid RWA Open Interest Reaches $4 Billion in 8 Months
HYPE Price Eyes $76 Recovery After Failed Breakout
Furthermore, the crypto analyst Sjuul highlighted that HYPE made another attempt to break into price discovery and surpass its all-time high, but the rally was met with a sharp rejection, halting bullish momentum.
Despite the setback, the broader HYPE price structure remains constructive, with traders viewing the pullback as a critical test rather than a trend reversal. Market participants are now watching closely for signs of renewed strength.
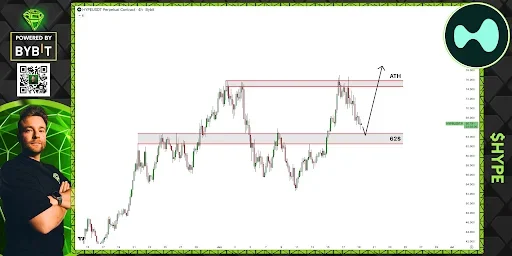

Source: Sjuul’s X Post
The attention is currently shifting towards the $62 mark that needs to be defended by the bulls and converted to good support.
Holding above the $62 level will create positive sentiment for the HYPE price and lay the groundwork for the next advance. The rally may target the $76 mark in case of continued dominance of the buyers.
RSI and EMAs Support Upward Momentum
According to TradingView, the HYPE price has a bullish rise on the macro front in April until June. The HYPE price experienced an all-time high of about $76.00000 and had a retracement move towards solid support at the 50-day EMA with a price level of $57.89205. In a quick move, buyers took the price higher to $69.48800.

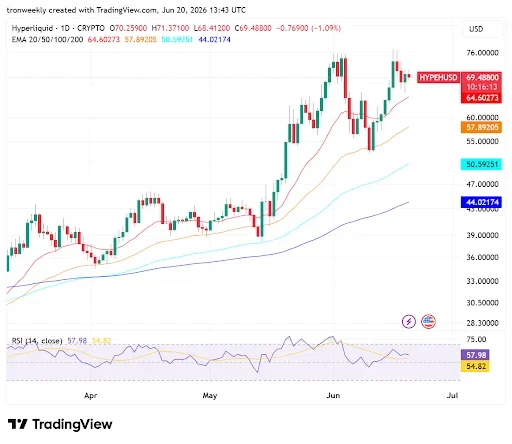
Source: TradingView
Technical bias continues to favor the bulls. In particular, the critical moving averages such as 20, 50, 100, and 200 are perfectly aligned, indicating a sustainable and long-lasting uptrend for the HYPE price.
On the daily chart, RSI is at 57.98 and well above its signal line, implying that the buyers continue to hold a strong grip on the market despite the sideways move.
This article contains market analysis and price predictions. These are not guarantees. Crypto markets are volatile. Always DYOR. Not financial advice.
Also Read: HYPE Price Consolidates Near $62 Support as Traders Eye $76 Breakout

Be the first to comment