


After a dramatic correction from the $70–$76 range, Hyperliquid is having trouble regaining its bullish momentum. As of right now, HYPE is trading at $54.54, trapped between significant resistance above and sustained support below. The cluster of moving averages around $56.65-$56.90 is the current issue.
Hyperliquid’s recovery is shallow
After declining in early August, HYPE momentarily recovered toward this area, but buyers were unable to establish a price above it. The recent increase appears more like consolidation than the start of another sustained rally as long as the token stays below $57. At about $61.09, stronger resistance is located.
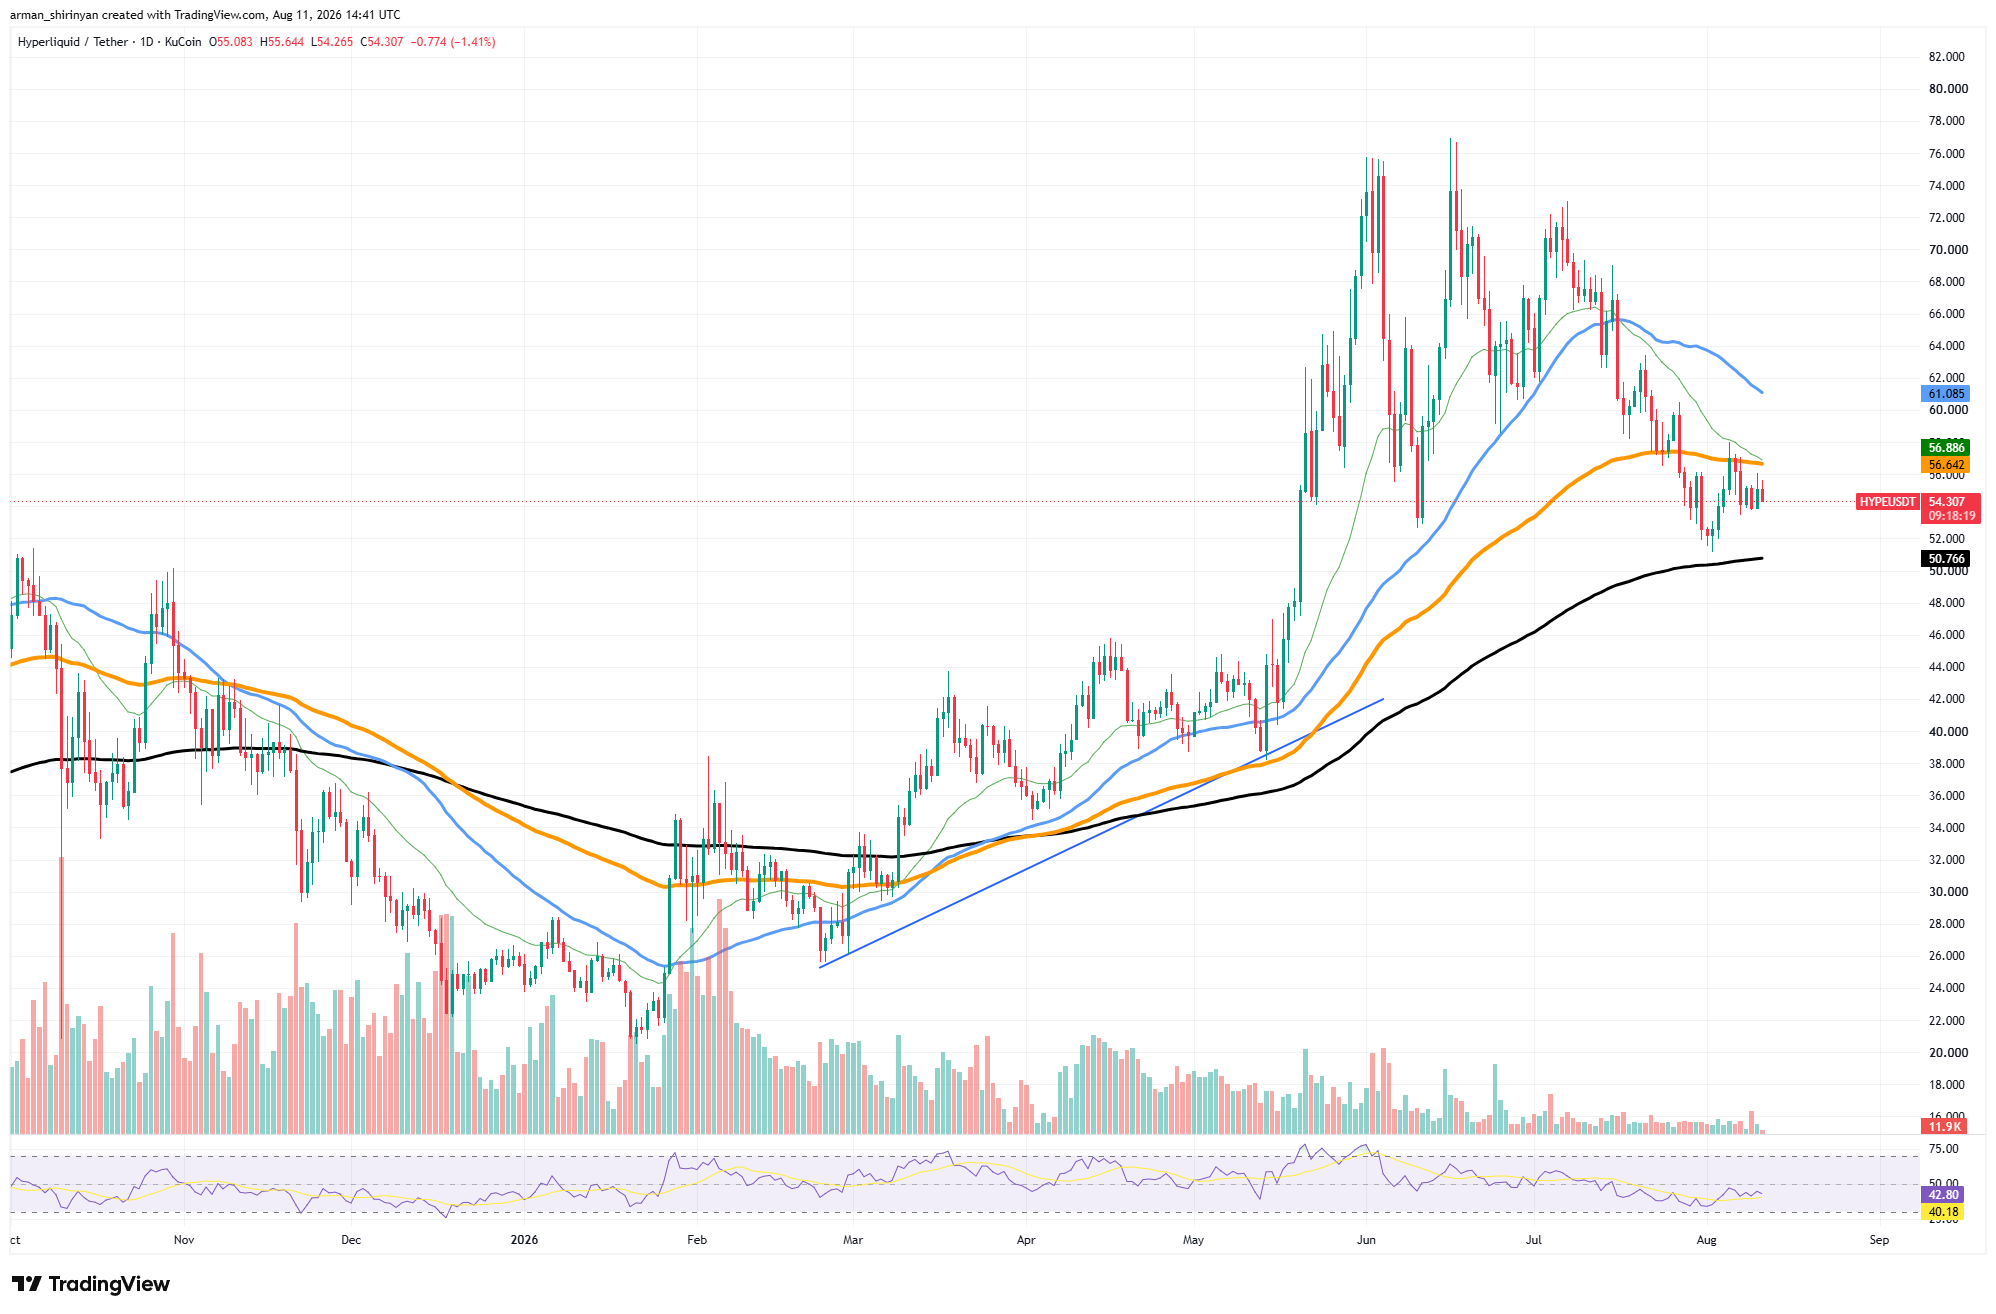
The short-term structure would be greatly improved by regaining that level, and the $65–$68 range might be reopened. HYPE might attempt another move toward $70 after that. The long-term moving average at around $50.77 is the most significant support on the decline. $50–$51 is a crucial technical threshold because HYPE has stayed above it during the most recent correction.

Losing it might expose the upper-$40 range and harm the recovery structure as a whole. The RSI is close to 43.3, indicating weak momentum without going into oversold territory. HYPE is still in a neutral-to-bearish consolidation for the time being. The first improvement would be a move above $57, and a stronger reversal signal would still require a move above $61.
Ethereum in a complicated position
With price compression becoming more apparent following the rebound from June’s lows, Ethereum is still consolidating just below $1,900. Right now, ETH is trading at about $1,880, just above its short-term moving average of about $1,875 but below resistance at about $1,922.
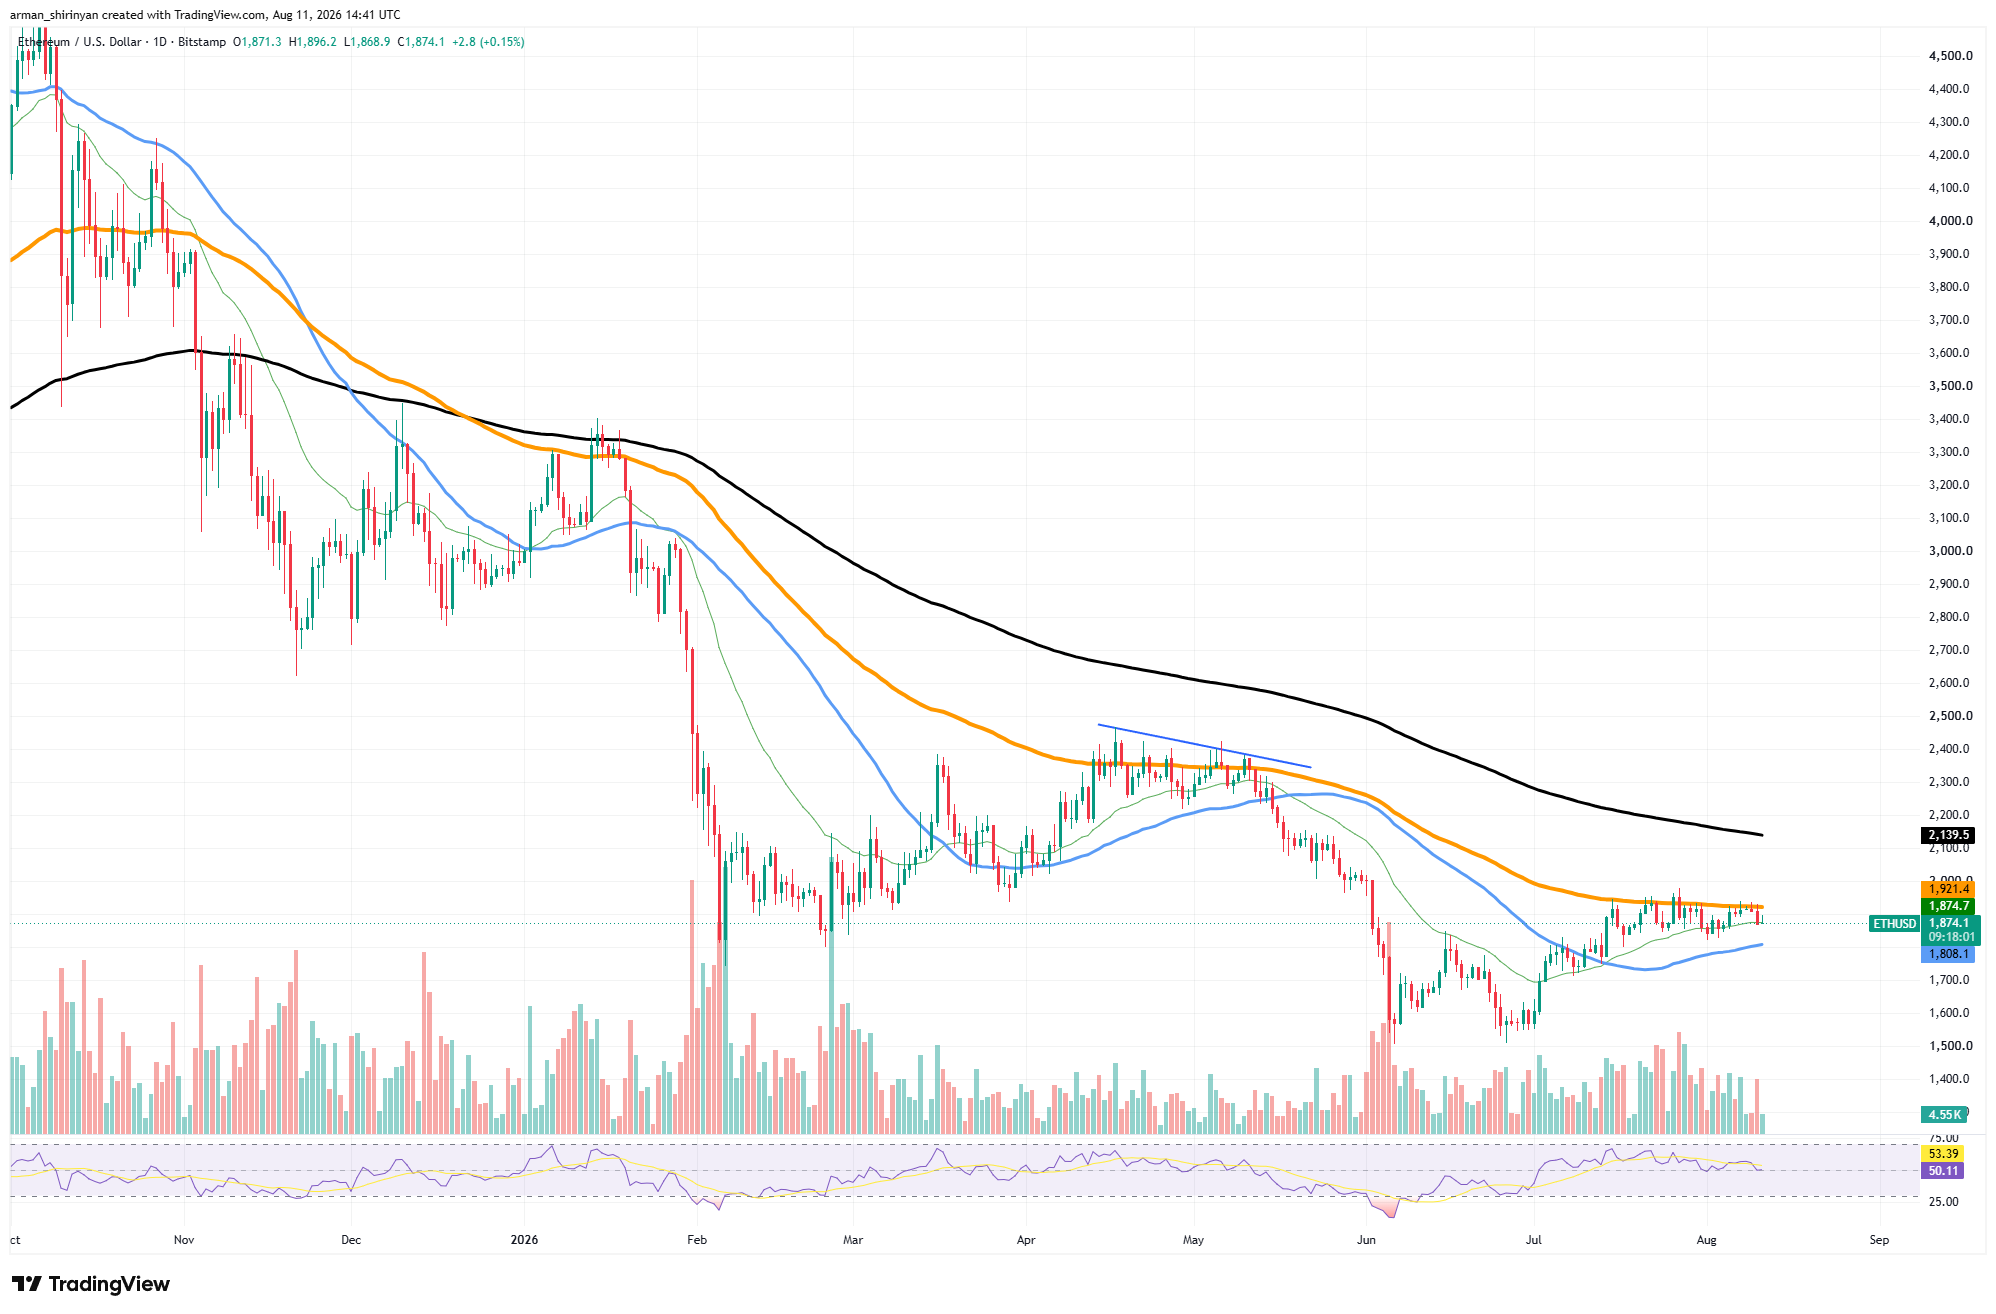
Since late July, buyers have consistently stalled in this $1,900–$1,925 range, making it the immediate breakout threshold. The technical configuration is mixed. Since declining toward $1,550 in June, Ethereum has maintained a series of higher lows, while the shorter moving averages have started to rise.
A stronger dynamic level near $1,808 follows the unaltered support around $1,875. At roughly $2,140, ETH is still well below the long-term moving average. This indicates that despite the improvement since June, the broader trend has not yet moved into a confirmed bullish structure.
Also, momentum has decreased. The RSI’s signal line is close to 51, and it is currently at 53.5. This reading reflects the tight price consolidation and gives neither side a significant momentum advantage. The most significant short-term development would be a daily breakout above $1,925, which could refocus attention on $2,000.
The next big target after that is the $2,100–$2,140 range. On the other hand, the likelihood of a return toward $1,800–$1,810 would rise if $1,875 were lost. As a result, Ethereum is still in a recovery structure, but buyers must break the $1,900–$1,925 ceiling before a significant upside continuation is technically plausible.
Bitcoin remains in a narrow downtrend
With neither buyers nor sellers building up enough momentum to compel a decisive move, Bitcoin is still trapped in a narrow consolidation around $63,900. The $63,000–$67,000 range is increasingly central to the current structure. Bitcoin is trading almost exactly between its two shorter moving averages.
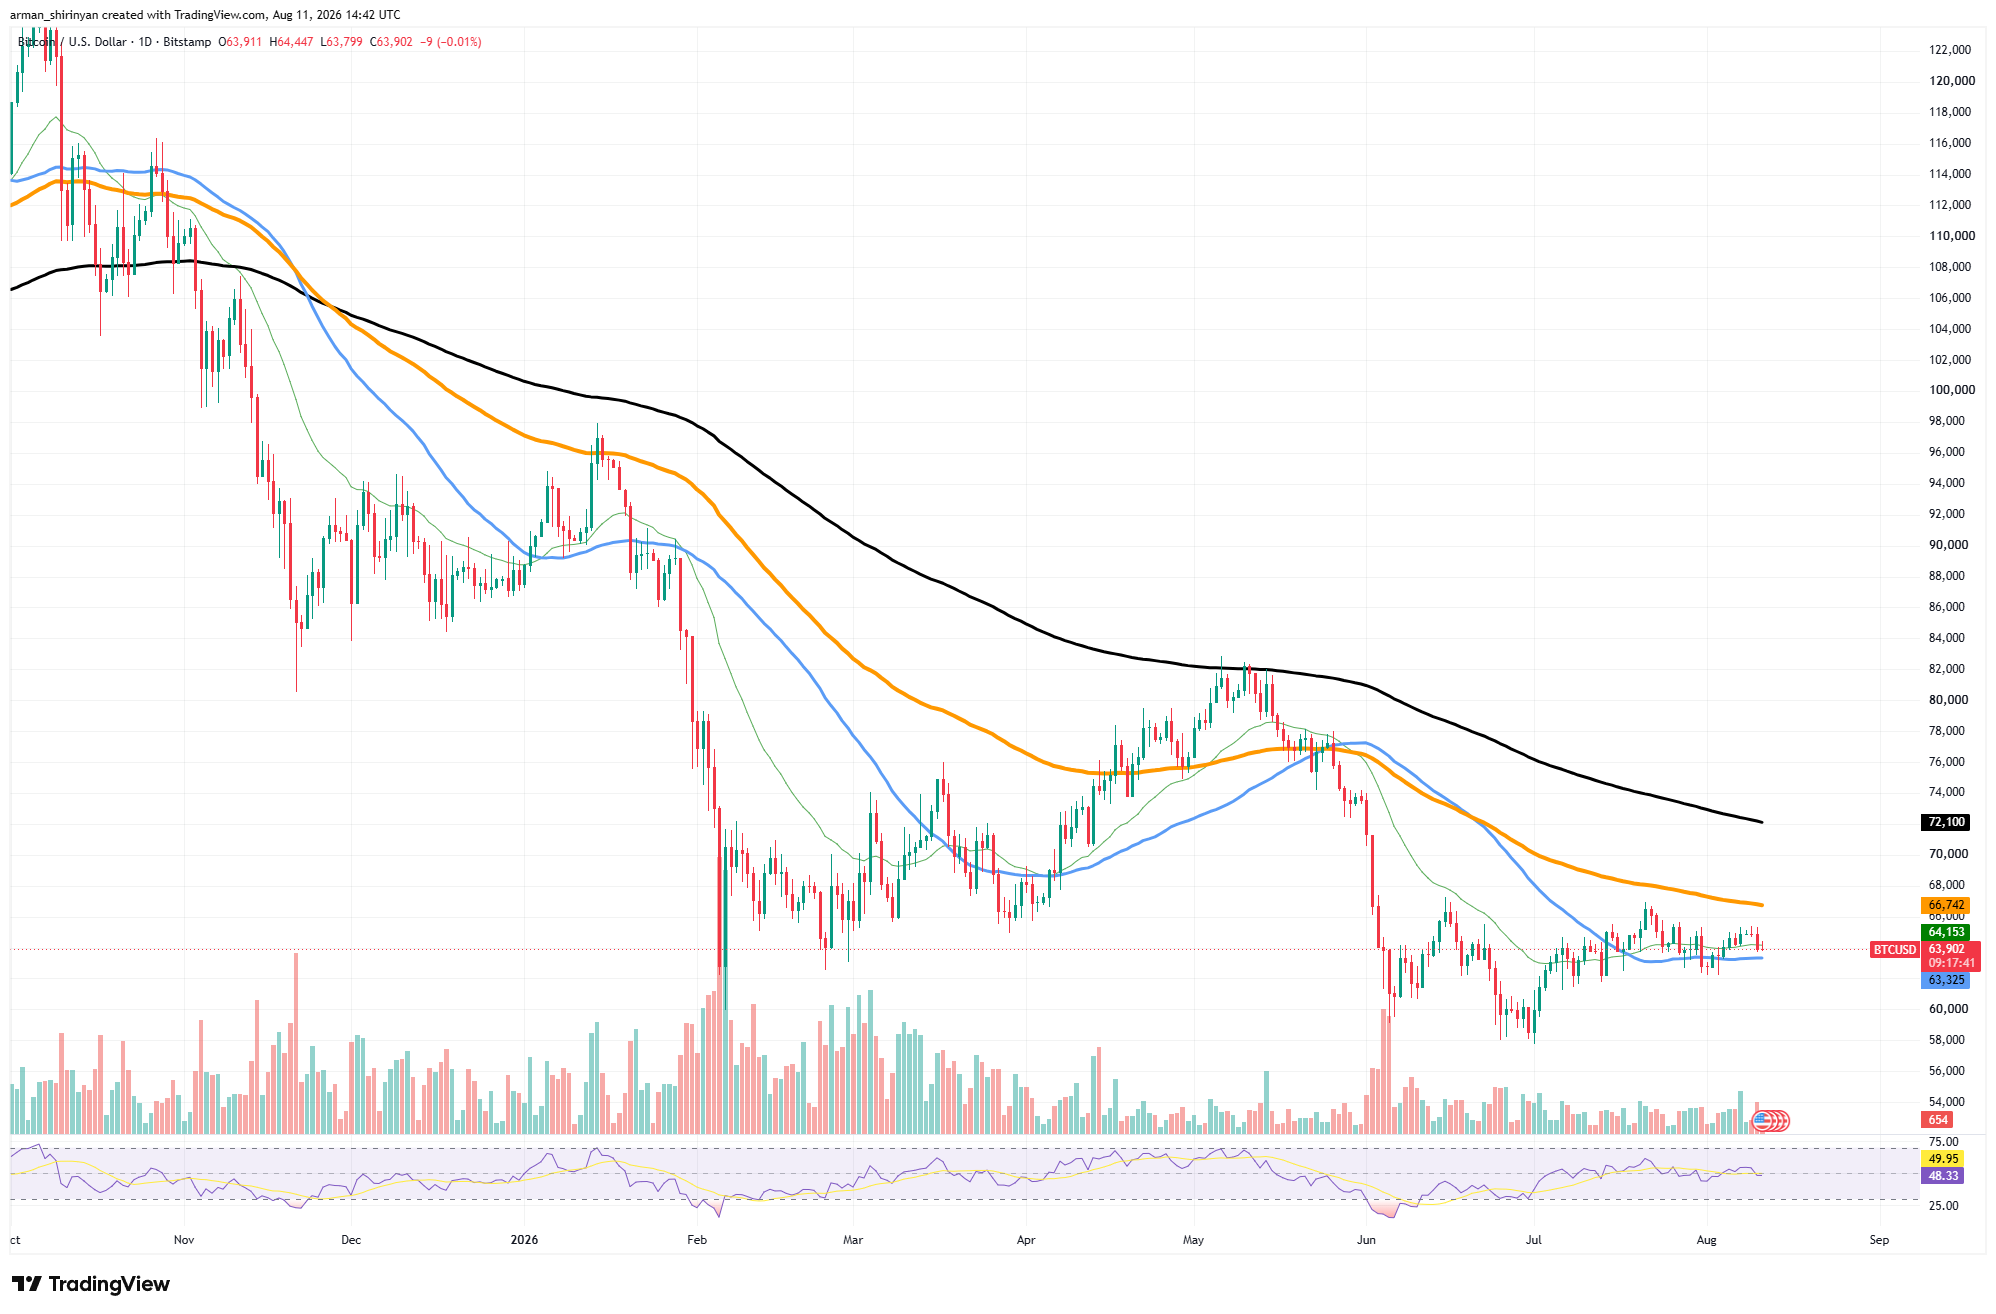
The faster average is marginally higher at about $64,154, while the closest support is at about $63,325. The sideways price action that has predominated since the start of July is reflected in this compression. Overhead resistance is still the main issue.
The first significant barrier to any recovery is $66,000–$67,000, as Bitcoin is still trading below the falling moving average around $66,742. At about $72,100, the long-term average is still much higher. Momentum provides minimal directional assurance. The RSI has dropped to about 48.4, which is slightly below the neutral 50 threshold. This is in line with the price’s apparent lack of follow-through.
The current structure would be weakened by a break below $63,300, bringing $60,000 back into focus, followed by the June low of about $58,000. On the other hand, recovering $66,700 would provide Bitcoin with its first significant technical advancement and might reopen a move toward $70,000–$72,100. As of right now, Bitcoin is still range-bound within a broader bearish structure.
Shiba Inu hits fresh support
After failing to maintain its late-July volatility spike, Shiba Inu is once again testing a crucial short-term support area. At the moment, SHIB is trading at about $0.00000450, almost exactly on the moving average at $0.00000445.
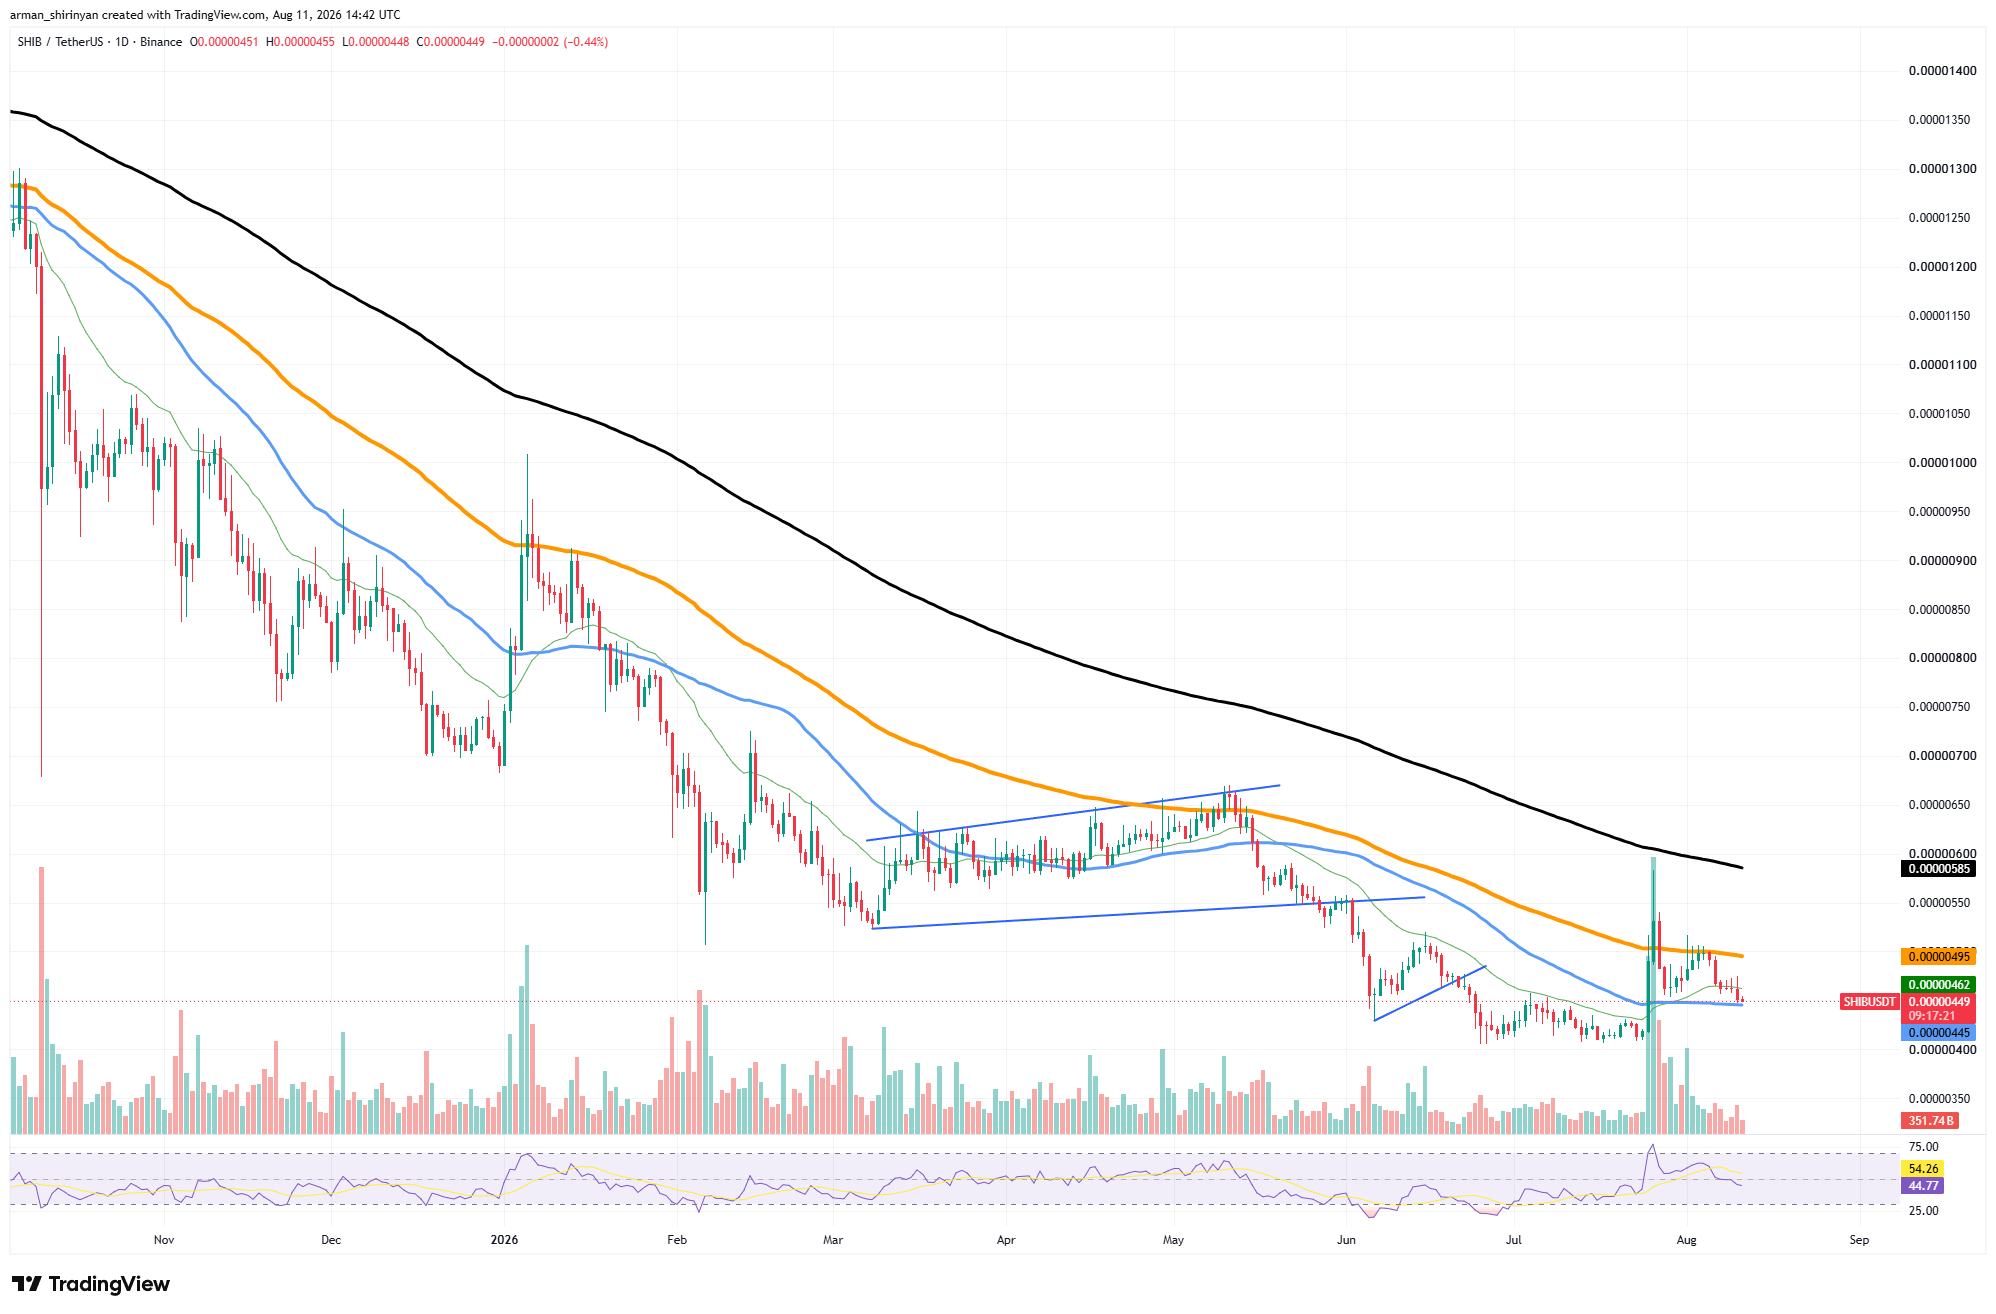
Additionally, the token has fallen below the faster average around $0.00000462, suggesting a decline in immediate momentum. SHIB briefly moved toward $0.0000058 due to the late-July spike, but the move was rejected almost instantly. The moving average near $0.00000495 became the main short-term resistance after the price was unable to recover. While the signal line average is still close to 54.3, the RSI has dropped to about 45.1.
Even though SHIB is still far from oversold territory, this divergence shows waning momentum after the unsuccessful breakout attempt. Now, the $0.00000440–$0.00000445 area is critical. A clean breakdown could reveal the July consolidation zone at $0.00000410–$0.00000420.
Another local low would be more likely if that area were lost. SHIB must first recover $0.00000462 and then break through $0.00000495 in order to initiate a bullish reversal. The long-term moving average at $0.000585 is still a significant barrier even after that. Despite its sporadic sharp volatility spikes, SHIB’s overall trend remains bearish until those levels are reclaimed.



Be the first to comment