


What to know:
- Hyperliquid (HYPE) price drops 4.20% to $57.55 after losing momentum from its $74.33 peak, signaling a short-term corrective phase.
- Technical indicators show weakness as price trades below the $62.90 Bollinger mid-band, with MACD confirming growing bearish momentum.
- Analysts highlight a potential head and shoulders pattern, with Fibonacci projections pointing toward the $50–$52 support zone.

Hyperliquid (HYPE) price faces pressure to sell on a short-term basis following a rally in the past. This is because the Hyperliquid price is declining from its peak levels.
Even though there has been high liquidity, the short-term trend has moved into correction because sellers have taken advantage of buyers’ weakness. The critical aspect will be determining if the Hyperliquid price continues its decline or holds the support levels.
At the time of writing, the HYPE is trading at $57.98, marking a 4.20% decline over the last 24 hours. Even with the drop, activity remains elevated, as 24-hour trading volume reaches $2.16 billion and market capitalization holds near $14.60 billion, suggesting continued engagement in the asset despite the correction phase.

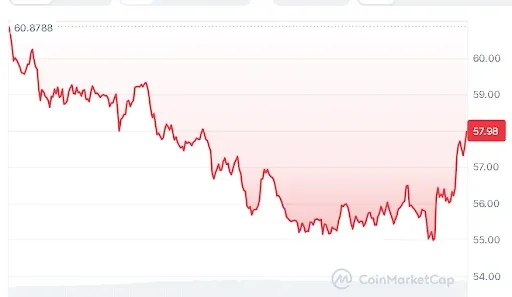

Source: CoinMarketCap
Also Read | BlackRock ETF Reduces Bitcoin Exposure With $61M Sale Amid Volatility
Hyperliquid Price Chart Signals Weakness After Rally
Hyperliquid price has experienced a slowdown since hitting an all-time high of about $74.33, with sellers becoming dominant and sending its price down. It is clear that the rally has slowed down for now, and the next focus will be on how support levels prevent further declines.
On June 10, 2026, a well-known crypto analyst, BATMAN, revealed that there was a formation of a head and shoulders pattern visible on the price action charts.
Furthermore, he mentioned that additional pressure coming from the market is also helping to bring about this decline. In terms of Fib projections, it is believed that around $50, or 1.618, will provide support for this currency pair if the selling continues.


Source: BATMAN’s X Post
HYPE Price Weakens Below Key Technical Levels
From a technical view, HYPE price is trading below its middle Bollinger band set at $62.90, signaling bearish pressure. Its lower band at $51.46 becomes the new resistance zone that can serve as a support level for the bulls to regain their footing.


Source: TradingView
The momentum indicators also suggest the same about the existing downward pressure on the price of Hyperliquid. The MACD indicator line stands at 2.53, which is below the signal line, 4.26, whereas the histogram stands at -1.73, indicating stronger negative momentum. An increase in price above the signal line will be required to change the trend.
Overall, the HYPE price will continue its corrective process following its rise; the key support area for future price stabilization or further fall lies in the $50-$52 range.
This article contains market analysis and price predictions. These are not guarantees. Crypto markets are volatile. Always DYOR. Not financial advice.
Also Read | Meta and Reliance Unveil Landmark AI Data Center Project in India

Be the first to comment