


What to know:
- The optimism (OP) price shows bullish breakout momentum as trading volume surges over 107%, signaling rising investor interest
- Technical breakout above inverse head-and-shoulders neckline confirms potential trend reversal in Optimism (OP) price action
- Analysts project Optimism (OP) could rally toward $0.20–$0.21 if current support levels and breakout structure remain intact

Optimism (OP) is moving in a positive price trajectory despite BTC’s downward movement after a break above $82K. Furthermore, the Optimism (OP) price breakout is also supported by the rising open interest and volume. According to CoinMarketCap, OP is currently trading at $0.1446, with a 24-hour gain of 6.38%.
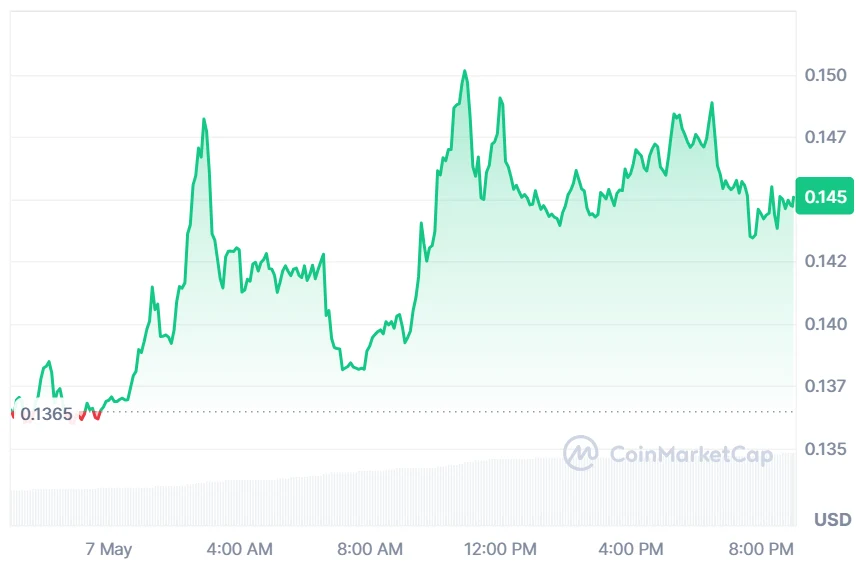

Source: CoinMarketCap
OP Derivative Data Point to Strong Upward Potential
According to Coinglass, the OP open interest climbed 16.53% to $96.61 million, signaling a noticeable rise in outstanding derivative positions. This growth may reflect increasing trader commitment, stronger speculative activity, or expectations of future price movement.


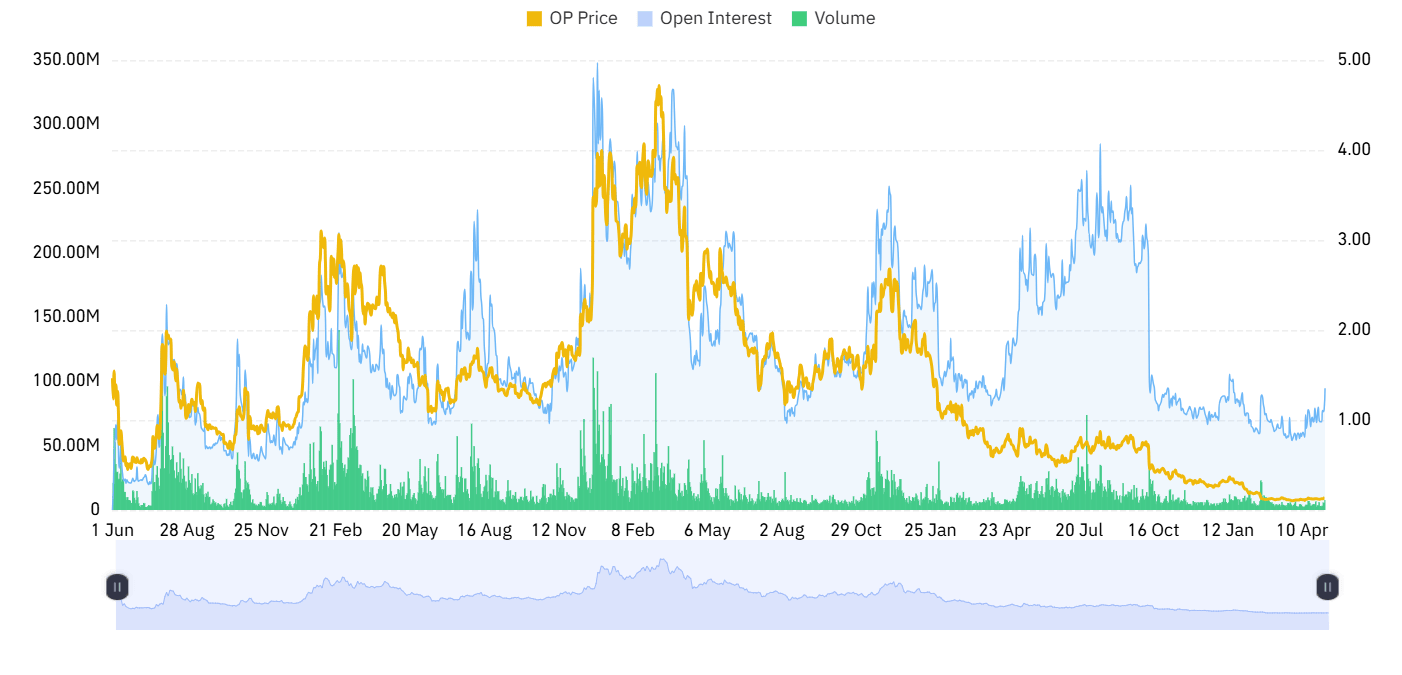
Source: Coinglass
Trading volume surged by 107.61%, reaching $325.95 million and reflecting significantly stronger market activity.
The sharp increase suggests rising investor participation, heightened liquidity, and growing confidence among traders. Such momentum often indicates stronger short-term sentiment and increased attention toward assets.
Also Read: Optimism (OP) Shows Strong Bullish Signals With an Explosive Rally Toward $5
Optimism (OP) Price Breakout Signals Reversal
Furthermore, the crypto analyst Chiefrat revealed that Optimism is showing bullish signs of breaking out as the token broke above its neckline on the daily chart in an inverse head-and-shoulders formation, which is often regarded as a trend reversal. The support region of $0.136 to $0.140 now acts as a significant level for bulls to defend.
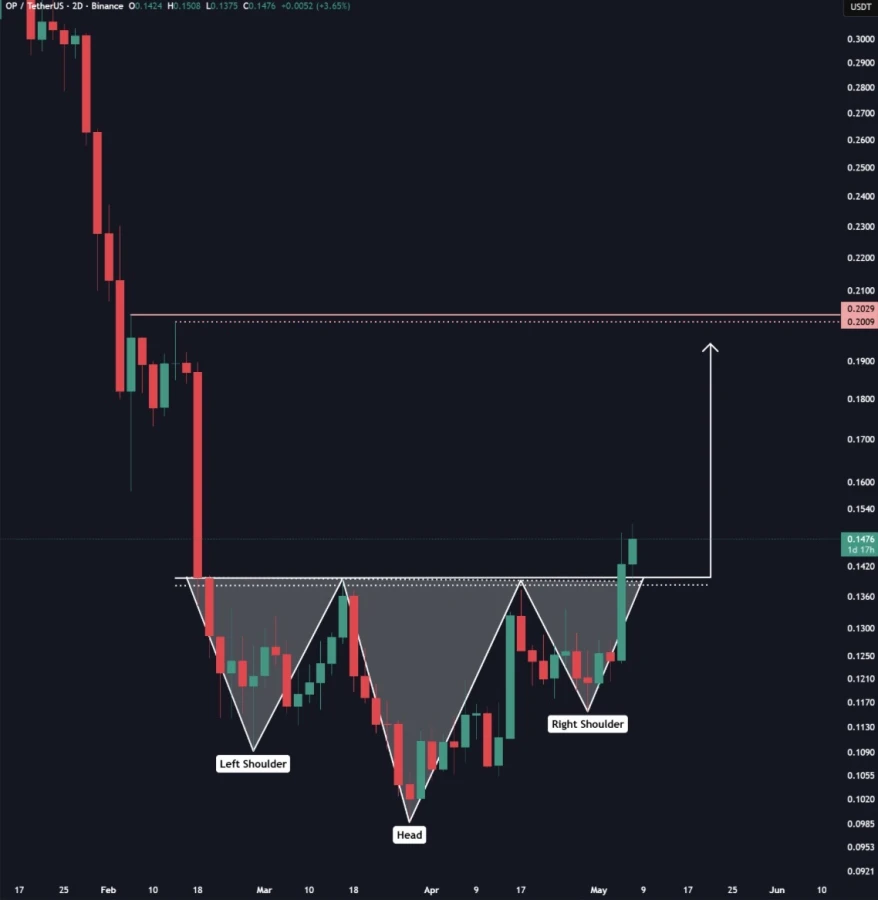
Source: Chiefrat’s X Post
If the Optimism (OP) price remains above the breakout area, the bullish pattern is still considered valid and can potentially take the price up towards the next resistance level at $0.20-$0.21.
This upward trend has created positive sentiment for the Optimism (OP) price, and an extended rally can attract buyers in the future.
OP Technical Indicators Point to Improving Momentum
According to TradingView, the Optimism (OP) price on the daily chart shows a transition from a negative drift trend to the edge of an escape from it. Having formed a strong support level at $0.1000 for two months, the price continues its advance towards $0.1448.
The rise has surpassed the midpoint of Bollinger Bands, which could suggest the end of prolonged selling pressure.
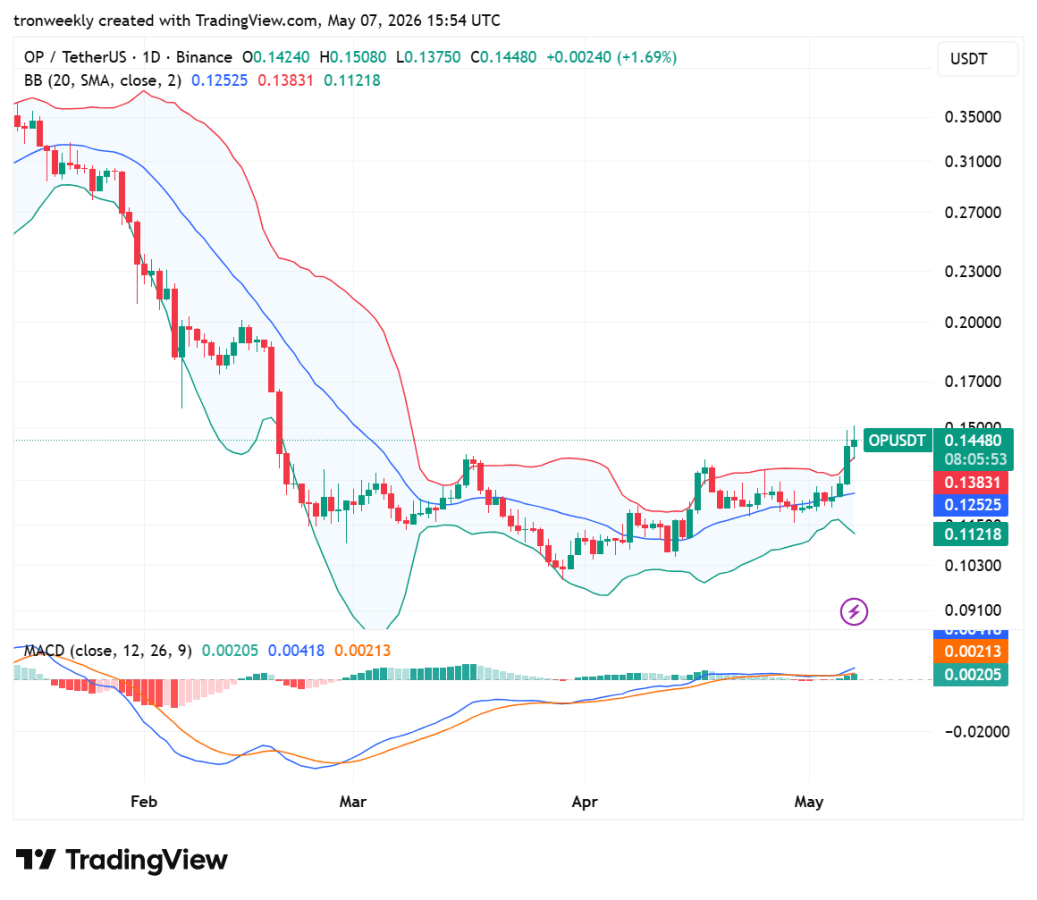
Source: TradingView
Technical indicators reveal that bullish momentum is picking up pace. MACD indicates a golden cross as the green bars on the histogram rise, signaling more buyers coming into the market.
With the Optimism (OP) price testing the upper Bollinger Band, remaining above the $0.1252 resistance zone is crucial for the bulls to move forward towards previous highs.
This article contains market analysis and price predictions. These are not guarantees. Crypto markets are volatile. Always DYOR. Not financial advice.
Also Read: Optimism (OP) Descending Channel Breakout Could Trigger Strong Rally to $1.30

Be the first to comment