


What to know:
- Celestia (TIA) shows early bullish reversal signs after reclaiming a key support zone, with analysts eyeing a move toward $0.60.
- A bullish MACD crossover signals renewed momentum, raising the chances of an upward breakout despite recent volatility.
- TIA remains inside the Ichimoku cloud, suggesting a breakout could be nearing as consolidation continues.

Celestia (TIA) is showing encouraging signs of recovery after reclaiming key support levels and improving its overall chart structure. A bullish MACD crossover points to a possible breakout for the Celestia price and renewed buying interest, although mixed momentum signals suggest the token remains in a volatile and indecisive phase.
At the time of writing, TIA is trading at $0.3742 with a 24-hour trading volume of $57.96 million and a market capitalization of $344.09 million. Despite the 4.72% loss over the last 24 hours, the Celestia price structure and improving technicals point to a bullish reversal ahead.


Source: CoinMarketCap

Also Read: Celestia Price Outlook: TIA Accumulation Signal Possible Reversal to $8.250
Celestia Price Signals Reversal, Eyes $0.60 Target
Furthermore, the crypto analyst Scient pointed out that Celestia (TIA), one of the weakest-performing cryptocurrencies in recent years, is beginning to show encouraging signs of recovery.
Analysts point to a clean daily chart structure, highlighted by a strong impulsive move from demand near the lows. The Celestia price has also reclaimed a key daily support and resistance level, which has now flipped into support.


Source: Scient’s X Post
The improved technical configuration has instilled hope in the traders as they see signs that momentum is likely to shift in favor of buyers.
If the positive formation is maintained, then TIA can continue with the recovery trend and possibly return to the $0.60 level. This would be a significant change from the consistent poor performance of recent years.
MACD Bullish Crossover Point to Upward Breakout
According to TradingView, the daily chart of Celestia displays strong consolidation under highly compressed conditions within the dense Ichimoku cloud formation.
After a wild plunge to the price level of $0.28000 during early June and a recovery to the level of $0.40000, the Celestia price is confined to a trading range between the upper baseline of $0.38753 and the lower conversion of $0.35749.

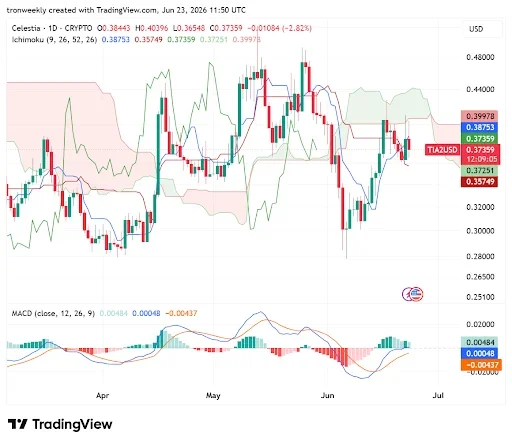
Source: TradingView
On the other hand, the MACD oscillator is indicating a very weak trend reversal as the blue bar re-crosses above the orange bar towards the zero line.
Even though the histogram has managed to move from negative red bars to positive green bars, the latter are now becoming thinner. This implies that the Celestia price continues to remain uncertain and unsteady.
This article contains market analysis and price predictions. These are not guarantees. Crypto markets are volatile. Always DYOR. Not financial advice.
Also Read: Celestia Price Surges After Breakout: Is a Strong Rally to $0.72 Next?
Be the first to comment